Introduction
The MESH Thesaurus provides the following definition of anthropometry: “technique that deals with the measurement of the size, weight, and proportions of the human or other primate body” (MESH, 2011). Anthropometry is used for various applications e.g. in anthropology, sports medicine, pediatrics and nutrition sciences. There are many various methods of anthropometry but the most common is the measurement of growth development indices (height, weight, circumferences of chest, neck, extremities, waist etc) and body composition (caliperometry and advanced intrascopic studies). Dependently on the specificity and sensitivity of the particular indices, they are used for the assessment of nutritional status. Nutritional anthropometry has several advantages (Gibson, 1990). Its methods are precise and accurate; there are used standardized and replicable techniques. The procedures are very simple, safe and non-invasive techniques. In the majority of cases, the equipment required is inexpensive, portable and durable, and can be made or purchased locally. Even unskilled personnel can perform measurement procedures after the short training. If data of the previous measurement were collected thoroughly the additional information could be generated on past nutritional history about the dynamics of nutritional profile. The anthropometry methods are quantitative and they could quantify the degree of malnutrition or overnutrition. They are also applicable for individuals as well as for large population groups e.g. representative population samples in the national surveys. We use nutritional anthropometry to monitor and estimate changes in nutritional status over time – for the short periods (seasons, years) and for the extended ones (generations) with the determination of secular trends of growth development and population nutrition. Anthropometric measurements could be used as the screening method for identifying risk groups (ibid.).
This practical study was aimed to assess the nutritional status of students by the anthropometric data.
Methods
To determine the body length in standing position there was used anodized aluminium stadiometer which is presented by the vertical measuring rod with the length of 2 m fixed on the basement with the sizes 70 x 45 cm. The measuring rod has scales of centimeter and inches marks. There is the mobile measurement slide with a horizontal plane, which is pushed downwards to close contact with the parietal bones of the tested person. When measuring body length the tested student should stay straight having his/her back to the rod and keep feet together and heels, buttocks and interscapular region against the rod. The investigator moves the head of the tested person so that the Frankfort Plane will be placed horizontally. The Frankfort (Prussian) Plane is a made-up line passing from ear tragus to the lateral eye angle. The results of measurement were showed in centimetres (cm).
To measure body weight there is necessary to use medical scales. Tanita system TBF-300A-310 was used alternatively. The results of measurement were showed in kilograms (kg). For measurement the tested person steps on the weighing platform in bare feet. The investigator checks if heels are placed on the posterior electrodes, and the front part of the feet are in contact with the anterior electrodes. Weight is displayed on the LCD.
The Body Mass Index (Quetelet’s index) is calculated by the formula: BMI = W/H2, whereas H is height (m), W – weight (kg).
To determine hand grip strength there was used hand dynamometer. The measurement could be repeated and the maximal result of measurement is recorded only. The results of measurement is showed in kilograms (kg).
The percentage of body fat is calculated by Siri’s formula: %BF = (4.95/BD – 4.5) x 100, where BD is body density.
Body density could be determined by the formula:
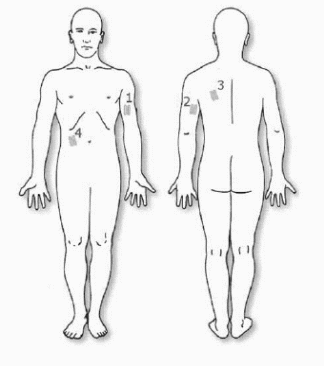
where mi – the result of skin fold measurement. We used 4 skinfolds (biceps, triceps, subscapular and suprailiac) as it’s shown at Fig. 1.

Alternatively to measurement of body fat percentage via caliperometry we assessed the percentage of body fat via bio-impedance scales (Tanita system).
Mid upper arm muscle circumference was determined by the formula: MUAMC = MUAC – 4.18 x TSF, where MUAC – mid upper arm circumference measured by centimetre tape (cm), TSF – triceps skinfold (cm).
The proportions of body were assessed by the indices of demispan (the distance from sternum to fingertip) and waist/hip ratio (Gibson, 1990).
The statistical processing was conducted using the standard option of MS Excell. The average mean (M) and standard deviations (SD) were determined and comparision between the whole group and separate gender group was provided.
Results
Summarising data from the spreadsheet demonstrated that the results of measurements for whole group were heterogenic (Table 1). This fact could be explained by the gender differences. When the results obtained for males and females separately the heterogenity of data was decreased.
Table 1: Results of the measurements (M±SD)
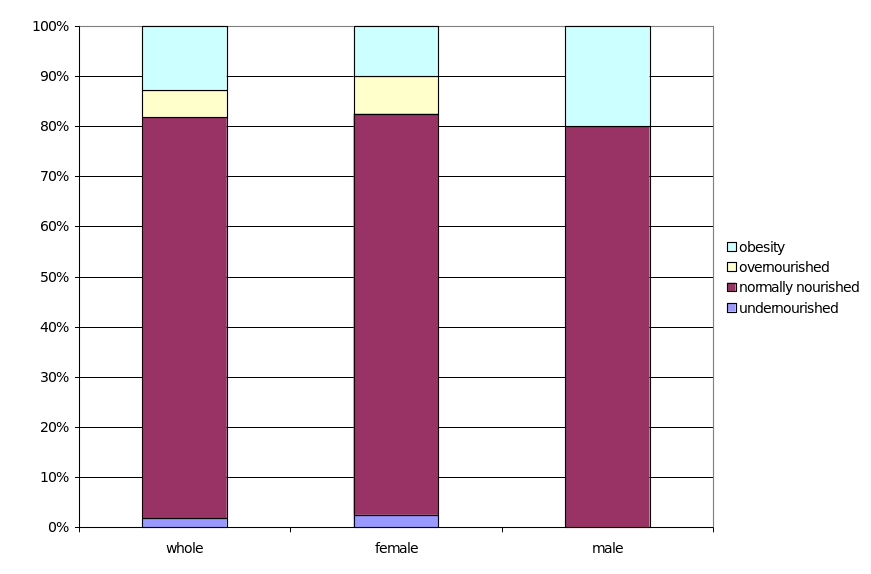
The differences between the groups were not significant but the indices of body fat percentage were relatively lower in the male group whereas the indices of grip strength and waist/hip ratio were higher. This fact could be explained by the gender differences. 20% of examined male students were obese (BMI>30 kg/m2). There were 4 (10.0%) obese female students and 2 of them has BMI>39.0 kg/m2. One girl was undernourished – BMI=17.4 kg/m2, %BF by the impedance data – 17.0%. These persons require correcting their diet and modifying life style. The data about the persons with deviations in their nutritional profile is provided at the Fig. 2

Discussion
The obtained results were close to our expectations and similar to the wider population. The differences between males and females were not statistically significant and could be explained by the physiology of metabolism and the different amount of individuals with the deviation from the population standards (Craigie AM et al., 2011). The simplest techniques (measurement of height and weight) were quite sensitive but for the assessment of nutritional profile should be provided by the full set of anthropometric techniques. Some of these methods are useful per se for screening mostly whereas others – for advanced scientific research. The method of caliperometry gives quite useful results but foot-to-foot densitometry provides more accurate data.
Conclusion
Conducted measurements were useful for determination of the persons with abnormal nutritional status and could be applied for developing individualized recommendations about diet modification.
References
Chapman-Novakofski K. 2011 Meshing with MeSH. J Nutr Educ Behav. Vol. 43, no. 2, p. 75
Gibson, R.S. 1990. UK, Principles of nutritional assessment. Oxford, UK, Oxford University Press.
Geissler C. & Powers H. 2005. Human Nutrition 11th edition (Elsevier Churchill Livingstone) 743 p.
Craigie AM et al. 2011 ‘A feasibility study of a personalized lifestyle programme (HealthForce) for individuals who have participated in cardiovascular risk screening.’ Prev Med. vol. 52, no. 5, pp. 387-389