Abstract
Benchmarking is an important process for comparing a company’s performance to its peers or industry standards. In this regard, it is a vital management tool for assessing a company’s achievements, relative to the above-mentioned comparisons. In this paper, Huawei’s organizational performance is benchmarked against that of Apple. The latter company is the focal basis of analysis because it has consistently enjoyed a good brand reputation and profitability in the past decade. Using the narrative review method, this paper examines data from published sources of information to identify gaps in benchmarking for both firms and contains calculations relating to their financial and non-financial performances. Overall, the findings of this paper suggest that Huawei shows greater promise in exploiting future market opportunities because it is better aligned with investor, market and employee needs. Therefore, its performance is favourable compared to that of Apple.
Introduction
The smartphone industry is one of the most vibrant subsectors of the information communication technology (ICT) field. Characterised by fast-paced innovations, this tenet of the telecommunications industry has grown to become a multibillion-dollar sector with Apple and Huawei being some of the most active brands in the field (Green et al., 2018; Segers, 2016; Wang & Bai, 2019). Table 1 below shows the company logos and addresses.
Historical Background
Apple
Apple is a consumer electronics company that designs, manufactures and markets consumer electronic products and software. Started in 1971, the firm has positioned itself as a leading technology enterprise with expertise in computer software, electronics and online service development (Dascano, 2018). The organization’s vision is to be a “technological invention leader” but its mission statement is aimed “bringing the best user experience to its customers through its innovative hardware, software, and services” (Giachetti, 2017, p. 176).
In line with this objective, Apple believes in adopting simple strategies of creating the strongest impact on the market as opposed to employing complex plans that would detract it from focusing on projects that matter (Fleisher & Bensoussan, 2015). To actualise this goal, the organization relies on four key processes focused on improving user experiences, enhancing people’s lives, empowering the public through innovation to make new products and developing top-quality gadgets. Table 2 below summarises the company’s business activities and product tree.
Table 2. Apple: Summary of business activities and product tree (Adapted from Apple Inc., 2020).
Huawei
Huawei is a Chinese smartphone company whose mission is to connect people, individuals and homes to integrated technology through ultra-fast broadband connections (Huang, 2019; Ceylan, 2016). To achieve this goal, its core strategy is to invest in advancing artificial intelligence (AI) technologies to better adapt its customers with advancements in mobile phone technologies (Marr, 2019; Lysne, 2018). In line with this goal, the firm has shown intentions to build intelligence networks and sustain bandwidth expansion to better augment its clients’ needs with new technological capabilities developed in the industry (Tao & Cremer, 2016; Marr, 2019). Table 3 below summarises Huawei’s business activities and products.
Table 3. Summary of Huawei business activities and product tree (Adapted from Huawei Ltd., 2020).
In this paper, Huawei’s performance will be benchmarked against that of Apple Inc., subject to their financial and non-financial outcomes.
Literature Review
Introduction
This section of the paper addresses key concepts models and procedures associated with performance management and benchmarking for both Apple and Huawei.
Concept, Models and Importance of Performance Management Systems (PMS) In Firms
Performance management systems refer to processes and procedures developed by an organization to ensure its processes remain within relevant scope guidelines and criteria of assessment. These processes may be developed and implemented formally or informally, depending on an organization’s culture, management style or industry involved (Van Veldhoven et al., 2017). Researchers claim that performance management helps to identify operational problems, thereby giving managers adequate room to plan on how to address them (Lee, 2019; Na-Nan et al., 2017).
Different organizations have employed varied models of performance measurement. For example, some companies use monthly output quality targets as the main indicator for undertaking performance measurement processes, while others advocate for the use of financial performance indicators as grounds for undertaking this activity (Brown et al., 2019; Van der Hoek et al., 2018). Overall, these models are useful in understanding benchmarking concepts.
Concept, Models and Importance of Benchmarking
Benchmarking refers to the practice of evaluating a company’s performance based on a set of measurement criteria, such as industry or corporate performance. According to Lafuente et al. (2020), time, cost and quality are the main platforms for undertaking benchmarking processes. These criteria of assessments outline different types of benchmarking processes, but “best practice benchmarking” is the most commonly used type, as it uses quality metrics to evaluate a company’s performance (Suša Vugec et al., 2018).
Although benchmarking may be regarded as a one-off event, several companies employ it as a continuous process. When used in the right format, it could be a powerful way of realising organizational change because it aligns goals with internal organizational processes (Grifell-Tatjé et al., 2018). However, the results of benchmarking processes are often regarded as instruments for capturing a company’s performance within a specific period (Grifell-Tatjé et al., 2018). Stated differently, the findings of benchmarking processes are relevant to stakeholders only at the time of their compilation or generation. Benchmarking portends several benefits to businesses. For example, it is associated with proper planning of tasks in project management (Srivastava & Thomas, 2016; Koster et al., 2017; Risher, 2015). It is through such an exercise that companies will not only understand their competitors better but also comprehend forces that affect the business environment.
Key aspects of Benchmarking
Benchmarking is associated with several key aspects of business development, including transforming strategies into action and undertaking financial and non-financial performance reviews ation (Broome et al., 2018; Nambiar & Poess, 2016). The process of transforming objectives to action is identified below.
Objectives from Strategy to Action
The benchmarking process is characterised by several processes that enable firms to adapt their organizational plans according to their needs. Six steps are commonly followed when benchmarking. The first one includes understanding the scope of improvement and performance to develop a holistic understanding of what the process entails (Chen et al., 2020). The second stage is planning, which entails developing strategies that would comprehensively cover the scope of the project identified above. The third phase involves examining and evaluating peers in the industry to compare performance.
This stage of development involves identifying appropriate comparators that would be used to make the evaluation (Lee et al., 2017). The fourth step in the benchmarking process involves proposing strategies that would help to fill the aforementioned gaps. This stage of the learning process may involve customisation and development of meaningful reports. Lastly, benchmarking requires companies to monitor their performance effectively as the last stage of the evaluation process (Nambiar & Poess, 2016). The main goal of doing this is to make sure that the entire process remains within the original scope and timeline specifications.
Financial and Non-Financial Benchmarking
The type of benchmarking procedure used by an organization to review its performance largely determines the kind of outcomes that could emerge from the process. Financial benchmarking refers to the use of monetary metrics to compare corporate outputs. For example, sales, revenue, return on investment and profitability are key financial metrics used by companies to measure performance.
However, other companies may use non-financial metrics, such as social or environmental impact assessments, to perform the same review (Nambiar & Poess, 2016). These two techniques of assessment refer to the use of qualitative and quantitative frameworks of assessment. For example, evaluating corporate performance on environmental or social grounds is a qualitative issue, while basing the same assessment on profitability metrics is a quantitative issue. Therefore, the subjectivity or ability to quantify outcomes determines the kind of technique to use.
Measures and KPIs; what and how to choose
The smartphone industry is one of the most difficult industries to benchmark because different manufacturers use varied platforms to offer services to their customers. For example, Apple uses the iOS platform on its hand-held devises, while Huawei uses the Android platform. Similarly, these mobile phone companies use different chipsets and processors to manufacturer mobile phones, including ARM and MIPS (Nambiar & Poess, 2016). Siponen and Klaavuniemi (2020) add that most smartphone manufacturers are supported by customised subsystems, which make it difficult to compare with other companies, because a fair comparison would mean developing a standardised approach of assessment. Therefore, it is important to get the right benchmark to use.
Outcomes from Benchmarking
Based on the multifaceted nature of benchmarking operations, several outcomes could be realised from the process. One of them is improved operational efficiency because gaps identified in the benchmarking process could easily be filled by developing focused strategies that address the issues highlighted (Jain & Paul, 2020; Rocha & Guarda, 2018). Some other possible positive outcomes associated with benchmarking include the improvement of quality standards, enhancement of operational efficiency and increased customer satisfaction (Montavont & Papadopoulos, 2018).
The benefits of benchmarking notwithstanding, it has been linked with negative outcomes, such as the use of unfair metrics to assess a company’s performance because the process requires the standardisation of evaluation criteria, which may fail to capture the true picture of a company’s operational outlook (Chaffey & Smith, 2017). For example, two firms operating in the same industry, but different markets, may be compared to one another although market forces would dictate that performance outcomes would be different (Akinshin, 2019; Albanese & Manning, 2015). Therefore, there is a need to adopt a measured approach to comparing performance.
Summary
Overall, this literature review shows that the benchmarking process is an important activity for helping organizations to compare their performance with others. While this exercise has been readily adopted in the technology sector, challenges relating to its dynamism have made it difficult to undertake fair comparisons. Consequently, there is need to develop sector-specific benchmarks of evaluation. This background explains why benchmarking in the smartphone industry may be unique from other technological sectors. Stemming from these insights, key objectives that will be addressed in this study include:
- To identify the most appropriate key performance indicators in the smartphone industry.
- To evaluate Apple’s performance relative to Huawei.
- To identify notable patterns of differentiation by analysing Apple and Huawei’s performance data.
Benchmarking Exercise
Approach to Data Collection
Data were obtained from secondary sources of information, such as company reports, national databases, books and peer-reviewed journals. The keywords used to get the articles included “benchmarking” “Apple,” “Huawei,” “smartphone industry” and “technology.” These search terms were included in several databases, such as “Sage Journals,” “Emerald Insight” and “Google.” The first two terms were used to gather peer-reviewed journals, which were instrumental in developing the literature review part. Comparatively, data relating to company performance were obtained from “Google” by identifying several credible websites and databases that were instrumental in providing reliable information for the comparative analysis. Collectively, the information obtained from both databases were assimilated in the discussions, analysis and conclusion sections to answer the research questions.
Analyses
Financial Analysis
Horizontal Analysis
The horizontal analysis will be a basis for comparing the performance of Huawei and Apple. It involves examining line items and ratios for different items obtained from the income statements of both smartphone companies. Table 4 below shows findings for the horizontal analysis and it was calculated using the formula highlighted below.
(Amount in comparison year – Amount in the base year)/ Amount in a base year] x 100

Broadly, the horizontal analysis described above suggests that Huawei has had a better financial performance compared to Apple because of its positive YoY changes for different income-based items highlighted above. For example, Huawei’s revenue increased from $105,525,000 in 2018 to $125,633,000 in 2019, representing a 19.06% increase in net income, while Apple’s revenue dipped by 2.04% within the same period. Huawei’s positive YoY change could be attributed to an expansion of its consumer base.
However, the surge in operating expense of 23.63% within the same period could also be linked to management restructuring efforts aimed at improving the company’s efficiency because Apple only registered an 11.38% increase of the same measure between 2018 and 2019. The overall increase in operating expenses could signify a “tough” economic environment. Lastly, as income expenses relating to Huawei’s financial operations increase, there is a commensurate decrease in its net financing income, which further causes a decline in profitability. Comparatively, Apple reported a decrease in its income tax obligations from $70,898,000 in 2018 to $63,930,000 in 2019, representing improved efficiencies in its capital allocation requirements.
Its cost of sales also decreased by 1.2%, during the same period, further adding to its efficiency. Comparatively, Huawei reported a 20.97% increase in cost of sales, meaning that its research and development activities have been adding to its operational costs.
Vertical Analysis
The vertical analysis was used as another basis for making a comparison of Apple and Huawei’s financial performance. Calculations were based on the net sales (100%) and the findings presented in table 5 below.

The statistics highlighted above were computed as a percentage of revenue and both Apple and Huawei showed similar patterns in income statement items within the 2018 and 2019 financial periods because there were near-similar changes to cost of sales (61.7% vs. 61.4%) and gross profit items (38.3% vs. 38.6%). However, Apple reported a lower change to its operating expenses (11.6%) compared to Huawei’s 27.5%. This difference in performance measure is linked to the findings of the horizontal analysis, which showed that Huawei’s R&D expenses significantly contributed to an increase in its operating expenses. In other words, the difference in Apple and Huawei’s performance could be attributed to the latter’s investments in research and development, which have seen it come up with new product categories in the past three years, thereby increasing its cost of sales.
Trend Analysis
The trend analysis will be used in this analysis to identify patterns of financial performance over the last three years of operation. For computation purposes, the financial performance of Apple and Huawei will be analysed based on movements in market capitalisation, as highlighted in figures 3 and 4 below.
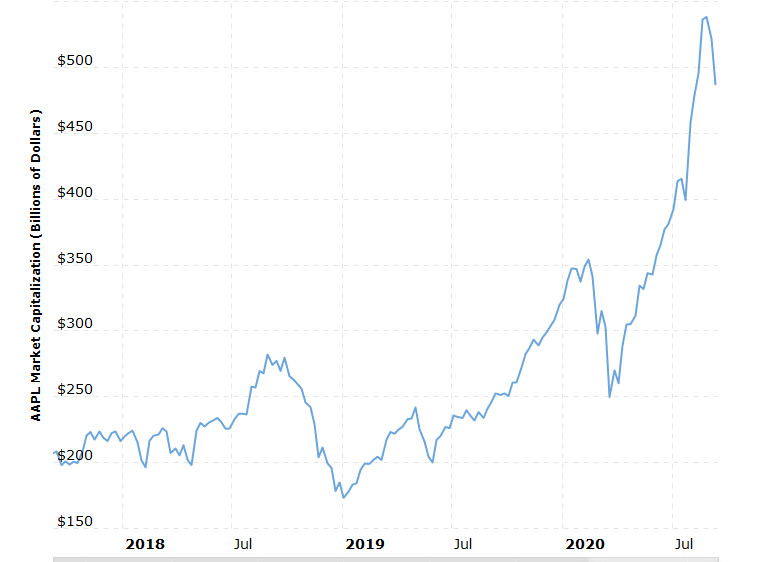
According to the data highlighted above, Apple’s market capitalisation has significantly increased from $200 billion in 2018 to more than $500 billion in 2020. Comparatively, as shown in figure 4 below, Huawei’s market capitalisation has increased from $1.5 billion in 2018 to more than $6 billion in 2020.
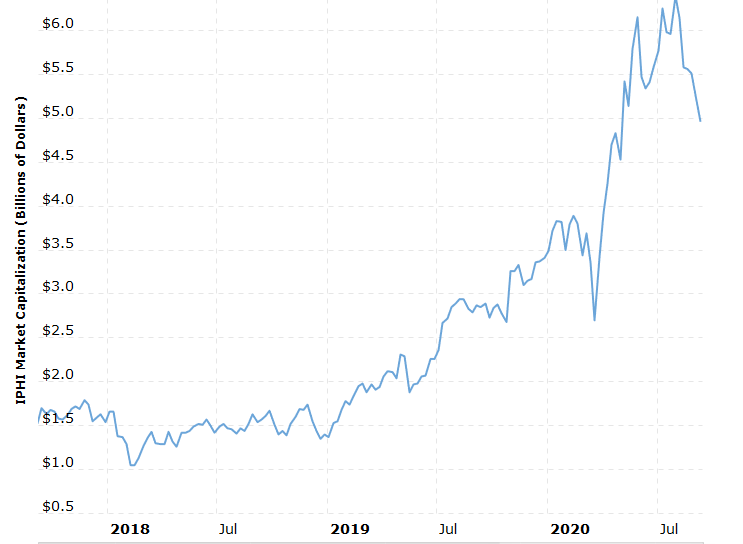
The above findings show that Apple and Huawei are exhibiting similar trends in stock and market capitalisations. This similarity could be attributed to the recent increase in investor activity around tech stocks, which has been occasioned by a rising interest in e-commerce and mobile money market interests. The trend is likely to persist in 2020 and beyond as investors position themselves to exploit a renewed interest in e-commerce activities occasioned by the COVID-19 pandemic.
Ratio Analyses
Liquidity Ratios
Liquidity ratios help investors to understand a company’s ability to meet its short-term financial obligations. Although different ratios are used to perform this evaluation, for purposes of this study, the liquidity of Apple and Huawei will be analysed using the current ratio. The formula is provided below, and the findings presented in the subsequent table.
Current Ratio = Current Assets/ Current liabilities
According to the data presented above, Apple has a better current ratio than Huawei, meaning that it is more favoured by lenders when advancing credit because of its strong ability to meet short-term financial obligations.
Profitability Ratios
Profitability ratios help investors to establish the probability of generating good returns on investments. To achieve this goal, the gross profit margin and return on assets of Huawei and Apple will be analysed below. The formula used to perform the calculations are highlighted below and the findings presented in the subsequent table.
Formula: Gross Profit Margin = (Revenue-Cost of Goods Sold) / Revenue *100%
According to the above data, Huawei has had a steeper increase in its profitability ratio compared to Apple. This difference in performance could be attributed to Huawei’s research and development activities, which are yielding positive returns for the firm. Comparatively, Apple has steadily maintained its profitability within the 19% – 21% range.
Lastly, the formula used to calculate the return on assets for both companies is highlighted below and the findings summarised in the subsequent table.
Return on Assets (ROA) = EBIT/Average Total Assets * 100
According to the data highlighted above, Huawei has registered a higher increase in its ROA compared to apple because of improved efficiencies in its asset utilisation capabilities. Comparatively, Apple’s ROA has remained relatively unchanged over the period under analysis, meaning that investors are getting steady returns.
Efficiency Ratios
Efficiency ratios help investors to understand how well a company is using its assets and liabilities. Different types of efficiency ratios could be used to achieve this goal. Some of them include inventory turnover, receivable turnover, and asset turnover. However, for purposes of this study, Apple and Huawei’s efficiency will be compared using the asset turnover ratio. The formula employed is highlighted below and the findings summarised in the subsequent table.
Asset Turnover Ratio = Sales / Average Total Assets
The findings highlighted above show that Apple’s asset turnover has remained steady throughout the period under analysis (0.7), while Huawei’s has only slightly changed from 0.48 in 2017 to 0.44 in 2019. The variation in Huawei’s performance could be attributed to its research and development activities.
Investment Ratios
The main type of investment ratio that will be analysed in this study is the price/earnings ratio, which relates to the market value of a company, relative to its earnings per share. The formula used to undertake the calculations is highlighted below and findings relating to the comparisons of Huawei and Apple’s performances highlighted in the subsequent table.
P/E Ratio = Share Price/Earnings per Share
The findings highligted above suggest that investors have a stronger confidence in Huawei’s profitability compared to Apple because of its higher P/E ratios, which reached 11.9 in 2019, while Apple’s was 5.76. Therefore, Huawei outperfroms Apple in this regard.
Nonfinancial Analysis
This analysis will be conducted by examining Apple and Huawei’s market share. Therefore, for purposes of this investigation, the main analytical area for non-financial performance will be the market share analysis. Figure 5 below highlights market share changes between the two companies which have occurred between 2009 and 2020.
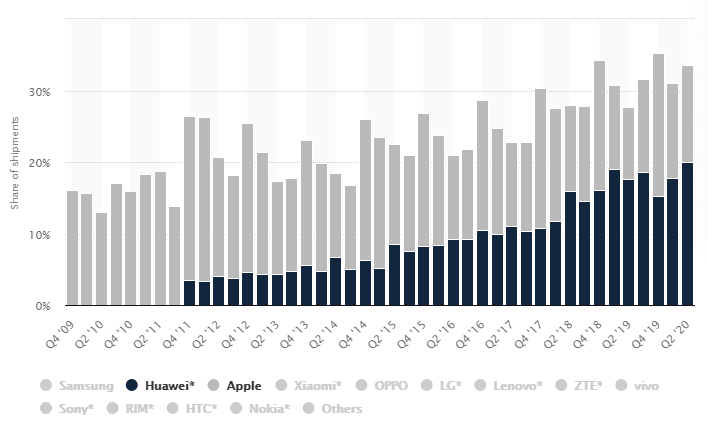
According to figure 2 above, Huawei’s market share has been steadily increasing from the year 2011 to 2020. Apple’s market share has also increased in the same fashion, but its rate of adoption is lower compared to Huawei’s. However, this fast gain in market share for Huawei within the past decade could be because of market entry advantages that elevate it above its competitors for being a new brand in the market. Figure 2 above demonstrates that Huawei market share for 2020 is nearing 20%, while Apple still maintains the lead at 32%. These findings mean that Huawei could soon overtake Apple in terms of market share dominance. The data highlighted above implies that the smartphone and technology industry, in general, is a volatile sector because competitors are always coming up with new strategies to outwit their rivals. This statement could be demonstrated by the rapid growth in market share for Huawei.
Company Potential
Understanding the potential of Apple and Huawei to overcome their operational issues requires an in-depth understanding of important performance areas of assessment affecting performance. In line with this need, Keyes (2016) and Pramudita (2016) mention the need to use formative evaluation tools, such as the SWOT analysis, to perform such an evaluation. This technique is used to evaluate the potential for both companies to grow, as highlighted in tables 7 and 8 below.
Table 7. Apple SWOT Analysis (Source: Developed by Author).
Table 8 below provides a comparative summary of Huawei’s SWOT table.
Table 8. Huawei SWOT Analysis (Source: Developed by Author).
As highlighted in the aforementioned tables, Apple and Huawei have different strengths, weaknesses, opportunities and threats that affect their potential for growth. Huawei’s potential for growth lies in leveraging its B2B relationships to gain a better understanding of new markets and fortify its existing market share, while Apple can expand its distribution networks and market segments to gain a deeper market penetration among new consumers.
Investor Potential
As highlighted in the financial and non-financial segments of this analysis, Huawei’s performance is still below that of Apple, but the Chinese company has a stronger investment appeal than the latter firm, as highlighted in figure 6 below because of its increase in market share.
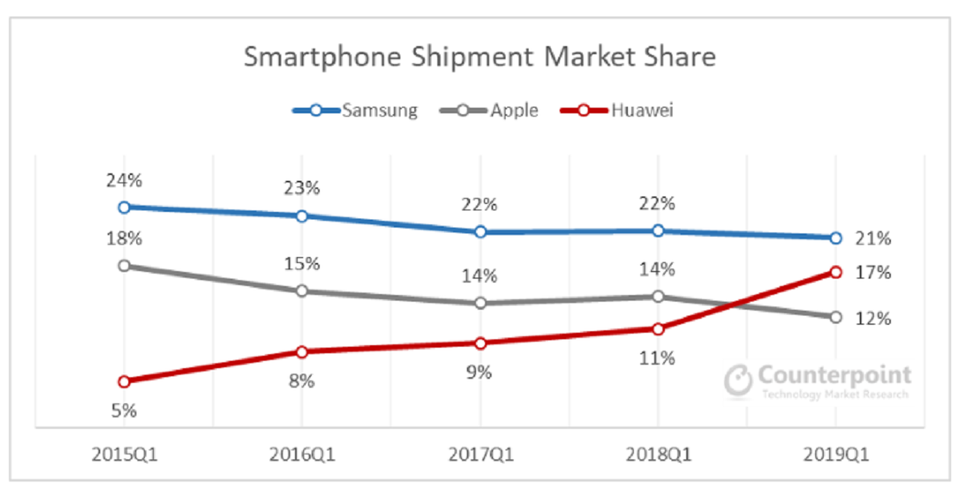
As highlighted in figure 6 above, Huawei’s market share is increasing, while Apple’s is declining. This outcome could be a product of the company’s rising popularity among young consumers because of the media hype generated about its 5G technology. At the same time, the company’s market share could be increasing because Huawei is in the middle of an economic trade war between the US and China. Therefore, the additional attention created from this dispute could have increased its publicity and public interest in the company.
Using Samsung as another peer of comparison, it emerges that Huawei has a better performance than the two players combined (Apple and Samsung) because their line graphs are decreasing, while Huawei’s is increasing. This trend suggests that Huawei is a more attractive investment in the year 2020 and beyond. A comparison of the stock price movements for the two companies highlighted in figures 7 and 8 below support the same trend but also show that Apple’s performance is at par with industry standards.
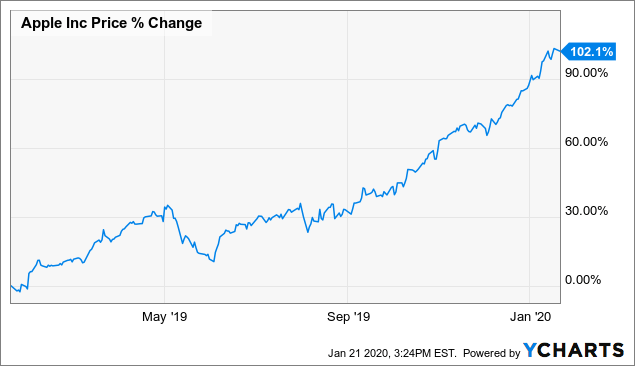
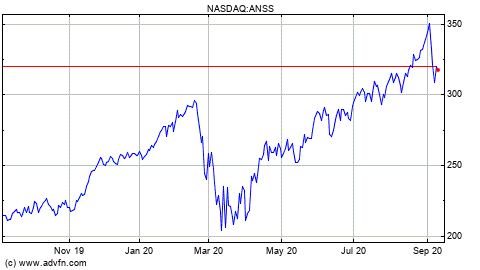
The positive stock price indices for the two companies highlighted above may suggest that there is a general optimism in the market regarding tech stocks (Wu & Murmann, 2020). Therefore, both Huawei and Apple are exhibiting similar patterns in stock price movements.
Employee Potential
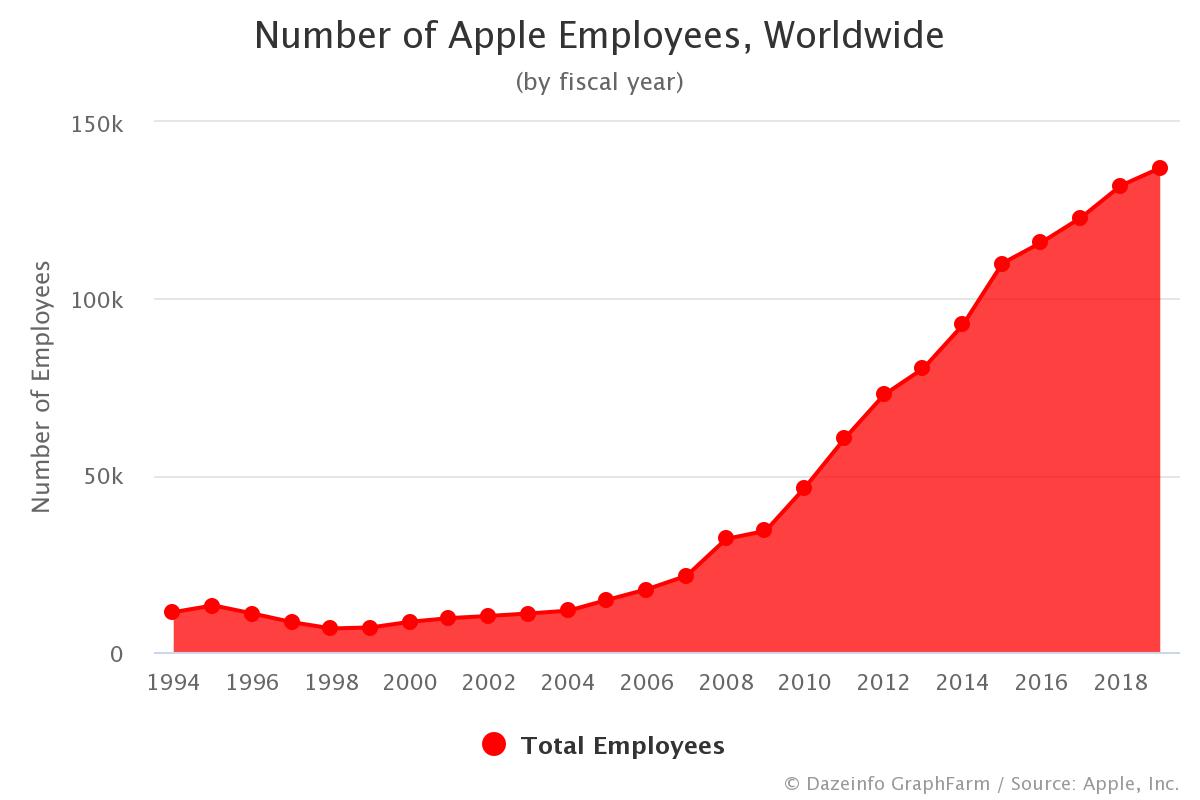
The attractiveness of Huawei and Apple to existing human resources capabilities depends on the overall strategic approach chosen by both companies in meeting their labour needs. As shown in figure 9 below, Apple has been increasing its number of employees worldwide, thereby showing promise that it will continue offering new work opportunities to thousands of more workers in the future.
Comparatively, as highlighted in figure 10 below, Huawei is showing similar potential by investing in its global employee population.
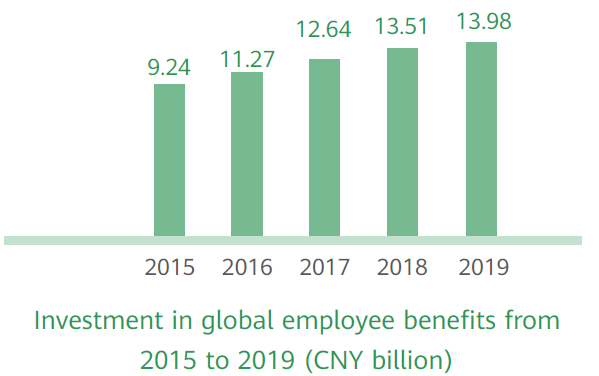
Particularly, Huawei has shown the greatest promise in improving the dynamism of its workforce, in terms of age and gender qualifications as highlighted in figure 11 below.
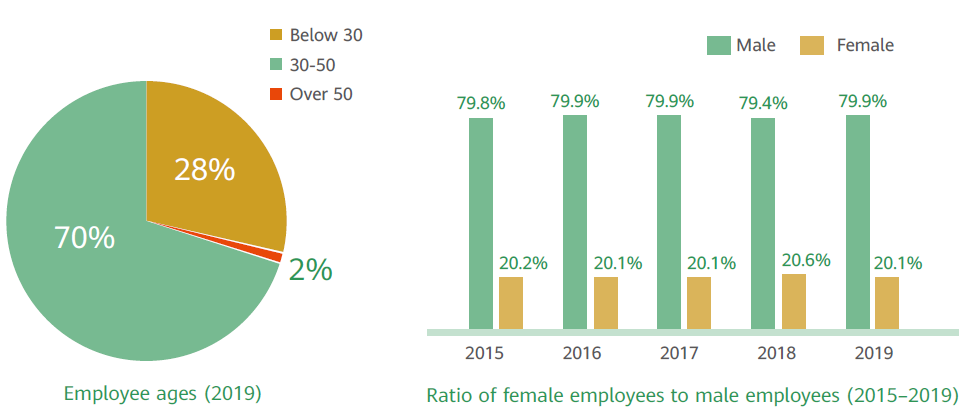
Overall, Huawei demonstrates a greater commitment in expanding the scope of its workforce. However, Apple gives its employees more benefits compared to Huawei because of its multiple employment packages (Apple Inc., 2020). For example, it gives its employees more healthcare benefit plans than Huawei does because of differences in labour benefits for US and Chinese workers. Similarly, differences in remuneration policies between both countries explain why Apple’s employees receive better salaries than Huawei workers. Additionally, the US-based firm offers its training opportunities, in-house, while Huawei has an open training program (Huawei Technologies Co., Ltd., 2020). This means that the latter can tap into externally generated values. Overall, both companies have unique capabilities in different functional areas of performance.
Discussions, Conclusion and Recommendations
Discussion
As highlighted in section 3.0 above, Huawei is trailing Apple in terms of market share and revenue generation capabilities. However, unlike, the California based company; Huawei has a higher growth rate, subject to financial and nonfinancial metrics of assessment.
In this regard, Apple needs to accelerate its pace of research and development because Huawei is quickly bridging the performance gap. While the results of this strategic direction may be fully comprehended in years to come, Huawei has shown more promise in giving investors a higher return on their capital than Apple because of its focused development in multiple areas of the mobile telephone market. Particularly, its investments in functional areas of application, such as its 5G broadband connectivity, shows the greatest promise in giving investors a higher return on their capital investments compared to Apple. In this regard, there is a gap in performance between Apple and Huawei.
Conclusion
From the onset of this study, the importance of benchmarking was highlighted within the context of the information communication sector and the smartphone industry in particular. The peculiarities of this industry, such as the existence of multiple operating systems used by different companies, made it difficult to identify key performance indicators that could be used to undertake a fair comparative analysis.
Consequently, the identification of relevant KPIs was one of the objectives of this study. The assessments done in sections 3.0 documents demonstrated that market share and revenue performance were reliable KPIs that could be used to undertake benchmarking processes. These platforms of analysis were further highlighted as benchmarks for reviewing the company’s financial and non-financial performances.
The second objective of this study was to evaluate Huawei’s performance relative to Apple. Therefore, Apple was advanced as the benchmarking standard because of its immense success in the smartphone industry. Furthermore, Huawei is a relatively new entrant in the smartphone market considering Apple ventured into the industry before it. The pieces of evidence gathered in this document reveal that Huawei shows greater promise in leading the next phase of technology revolution in the smartphone industry because of its heavy investments in research and development capabilities.
Compared to Huawei, Apple has failed to garner attention recently, because of the popularity of the contentious 5G technology developed by Huawei in the last few years. Concerns raised about the company’s immense capabilities to integrate this technology in their smartphones has even forced some governments, such as the US, to be concerned about Huawei’s capabilities in the future. These developments indicate that the Chinese firm is poised to have a significant impact on the market in the coming decades.
The last objective investigated in this study focused on identifying notable patterns of differentiation by analysing Apple and Huawei’s performance data. The results revealed that the main performance gaps were in investor and employee capabilities. Differences in performance that exist in their financial and nonfinancial outputs are progressively being minimised through the deployment of aggressive market expansion strategies by both companies and the rising popularity of both smartphone makers. Therefore, the main point of differentiation moving forward will be on how both companies offer value to their stakeholders.
Overall, the findings of this paper could be used to perform future forecasts in the smartphone industry and to enable firms to better prepare for forthcoming challenges based on the patterns of performance observed from the data gathered. The findings of this study could also be instrumental in helping either of the two companies to make improvements to their business process plans. For example, they could help them to better adapt to business best practices because benchmarking helps companies to adapt, change and thrive in an uncertain business environment.
Limitations
One of the biggest challenges associated with this project was determining the kind of data to collect based on the vastness of the scope of benchmarking processes adopted by smartphone companies. Relative to this fact, the choice of data collection was informed by the benchmarking databases available, as well as the type of information present in the public domain about Huawei and Apple. Future research findings should be developed through a primary research investigation to compare the results with the secondary findings presented in this document. Doing so would provide a reliable basis for corroborating the findings generated in this paper.
References
Akinshin, A. (2019). Pro.NET benchmarking: The art of performance measurement. Apress.
Albanese, J., & Manning, B. (2015). Revive: How to transform traditional businesses into digital leaders. FT Press.
Apple Inc. (2020). What we do. Web.
Broome, A., Homolar, A., & Kranke, M. (2018). Bad science: International organizations and the indirect power of global benchmarking. European Journal of International Relations, 24(3), 514-539.
Brown, T. C., O’Kane, P., Mazumdar, B., & McCracken, M. (2019). Performance management: A scoping review of the literature and an agenda for future research. Human Resource Development Review, 18(1), 47-82.
Chaffey, D., & Smith, P. (2017). Digital marketing excellence: Planning, optimizing and integrating online marketing. Taylor & Francis.
Ceylan, S. (2016). Huawei watch guide. Booksmango.
Chen, X., Fu, T. T., Juo, J. C., & Yu, M. M. (2020). A comparative analysis of profit inefficiency and productivity convergence between Taiwanese and Chinese banks. BRQ Business Research Quarterly, 23(3), 193-202.
Dascano, M. (2018). Apple iPhone Xs and Xs Max: Made easy. First Rank Publishing.
Fleisher, C., & Bensoussan, B. (2015). Business and competitive analysis: Effective application of new and classic methods. FT Press.
Giachetti, C. (2017). Smartphone start-ups: Navigating the iPhone revolution. Springer.
Green, P., Cheydleur, G., Li, K., Deng, R., & Sanchez, R. (2018). Free smartphone apps to support human factors/ergonomics work. Ergonomics in Design, 26(1), 4-16.
Grifell-Tatjé, E., Lovell, C. A. K., & Turon, P. (2018). The business foundations of social-economic progress. BRQ Business Research Quarterly, 21(4), 278-292.
Huang, W. (2019). Built on value: The Huawei philosophy of finance management. Springer.
Huawei Ltd. (2020). Products and services. Web.
Huawei Technologies Co., Ltd. (2020). Caring for employees. Web.
Jain, S., & Paul, S. (2020). Recent trends in image and signal processing in computer vision. Springer Nature.
Keyes, J. (2016). Implementing the IT balanced scorecard: Aligning it with corporate strategy. CRC Press.
Koster, M., Vos, B., & Schroeder, R. (2017). Management innovation driving sustainable supply management process studies in exemplar MNEs. BRQ Business Research Quarterly, 20(4), 240-257.
Lafuente, E., Leiva, J. C., Moreno-Gómez, J., & Szerb, L. (2020). A nonparametric analysis of competitiveness efficiency: The relevance of firm size and the configuration of competitive pillars. BRQ Business Research Quarterly, 23(3), 203-216.
Lee, H. W. (2019). Moderators of the motivational effects of performance management: A comprehensive exploration based on expectancy theory. Public Personnel Management, 48(1), 27-55.
Lee, J., Ko, J., & Choi, Y. J. (2017). Dhrystone million instructions per second–based task offloading from smartwatch to smartphone. International Journal of Distributed Sensor Networks, 2(1), 1-10.
Leo Printing. (2017). The history of the Apple logo. Web.
Lysne, O. (2018). The Huawei and Snowden questions: Can electronic equipment from untrusted vendors be verified? Can an untrusted vendor build trust into electronic equipment? Springer.
Macrotrends LLC. (2020a). Inphi market cap 2009-2020. Web.
Macrotrends LLC. (2020b). Apple market cap 2009-2020. Web.
Marr, B. (2019). Artificial intelligence in practice: How 50 successful companies used AI and machine learning to solve problems. John Wiley & Sons.
Montavont, N., & Papadopoulos, G. (2018). Ad-hoc, mobile, and wireless networks: 17th International Conference on Ad Hoc Networks and Wireless, ADHOC-NOW 2018, Saint-Malo, France, September 5-7, 2018 proceedings. Springer.
Nambiar, R., & Poess, M. (2016). Performance evaluation and benchmarking: Traditional to big data to internet of things. Springer.
Na-Nan, K., Chaiprasit, K., & Pukkeeree, P. (2017). Performance management in SME high-growth sectors and high-impact sectors in Thailand: Mixed method research. International Journal of Engineering Business Management, 7(2), 1-18.
NASDAQ. (2020). Huawei stock price history. Web.
Pramudita, C. D. (2016). The balanced scorecard as strategic controlling instrument. Introducing the indicators-based BSC for implementation of a corporate strategy from four different perspectives. Anchor Academic Publishing.
Rapoza, K. (2019). Huawei has taken over Apple’s market share in China; it will get worse. Forbes. Web.
Rathore, I. (2020). Number of Apple employees worldwide. Web.
Risher, H. (2015). Employers need to invest to strengthen performance management. Compensation & Benefits Review, 47(2), 55-59.
Rocha, A., & Guarda, T. (2018). Proceedings of the International Conference on Information Technology & Systems (ICITS 2018). Springer.
Seeking Alpha. (2020). Apple’s stock price and 5G: The hype and substance time lag. Web.
Segers, R. (2016). Multinational management: A casebook on Asia’s global market leader. Springer.
Siponen, M., & Klaavuniemi, T. (2020). Demystifying beliefs about the natural sciences in the information system. Journal of Information Technology, 8(2), 1-18.
Srivastava, R., & Thomas, G. (2016). The future of branding. SAGE Publications India.
Statista. (2020). Global smartphone market share from 4th quarter 2009 to 2nd quarter 2020. Web.
Suša Vugec, D., Tomičić-Pupek, K., & Vukšić, V. B. (2018). Social business process management in practice: Overcoming the limitations of the traditional business process management. International Journal of Engineering Business Management, 4(1), 1-10.
Tao, T., & Cremer, D. (2016). Huawei: Leadership, culture, and connectivity. SAGE Publishing India.
Van Veldhoven, M., Dorenbosch, L., Breugelmans, A., & Van De Voorde, K. (2017). Exploring the relationship between job quality, performance management, and career initiative: A two-level, two-actor study. SAGE Open, 6(2), 1-14.
Van der Hoek, M., Groeneveld, S., & Kuipers, B. (2018). Goal setting in teams: Goal clarity and team performance in the public sector. Review of Public Personnel Administration, 38(4), 472-493.
Wang, J., &, Bai, H. (2019). Entrepreneurship in the Asia-Pacific: Case studies. Springer Nature.
Wu, X., & Murmann, J. (2020). The transformation of Huawei: From humble beginnings to global leadership. Cambridge University Press.