This paper proposes performing a financial analysis of Beyond Meat, Inc., based on historical data obtained from the SEC. Only 2019-2021 data was available for Beyond Meat, Inc., so the financial analysis will be relevant for the last three years. The paper offers a consistent analysis of the company’s critical economic metrics over this period, a ratio analysis with calculations, and a comparison of the results obtained with industry competitors.
Financial Analysis: Income Statement
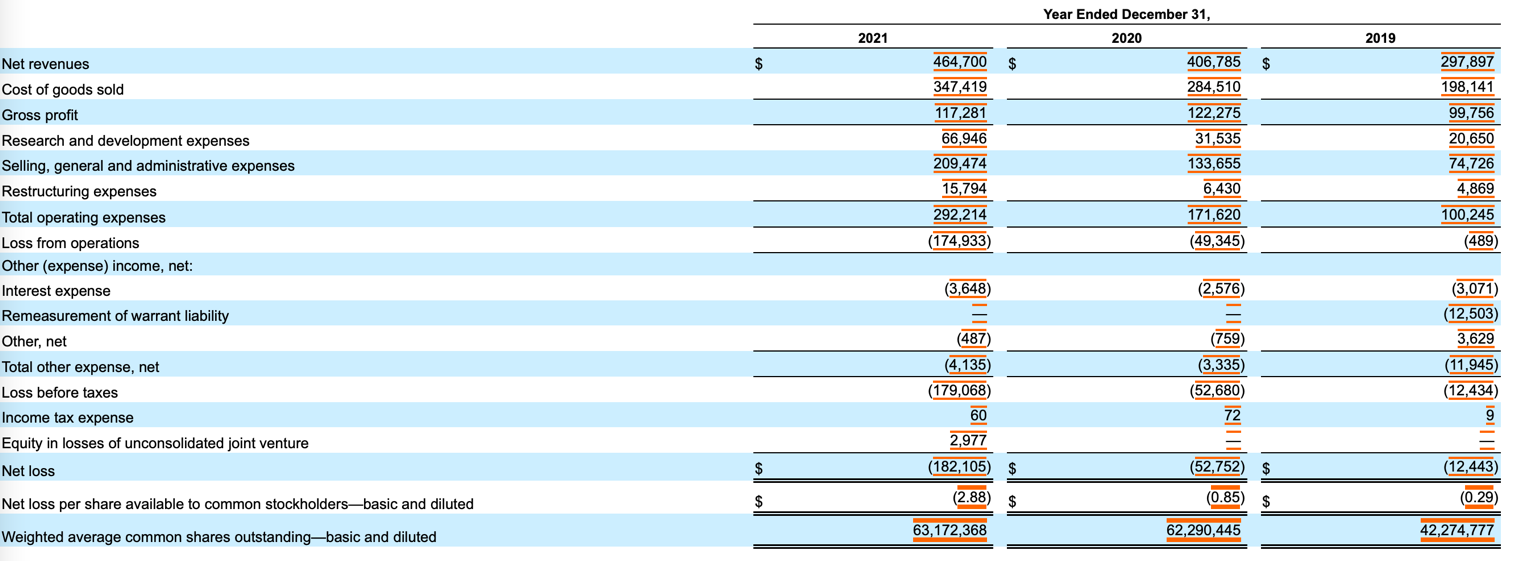
Appendix A presents earnings reports for the period 2019-2021. Turning to them in the context of horizontal analysis, we can see that the company’s revenue has grown significantly over the past three years, peaking at $464.7 million by 2021 and showing a 14% increase over 2020 (Table 1). Despite the increase in COGS, the company’s gross profit first rose and then showed a 12% drop by 2021. Beyond Meat, Inc. has grown rapidly over the three years, which may indicate an increase in R&D spending and company expansion; this is also justified by the fact that the company’s operating expenses were 59% of total revenue by 2021, and this share has shown steady growth for three years (Table 2). Also crucial to the income statement is operating income, which is profit after operating expenses before taxes (Boyte-White, 2021). Operating income turned negative for the first time in 2020 and then fell; it was only natural that net income continued to fall, meaning that Beyond Meat, Inc. was moving further and further away from its break-even point. In the same year, the company faced more non-recurring events, although by 2021 the figure had risen slightly. Finally, Table 1 and Figure 1 show a steady decline in the brand’s net income over three years, with net income falling by (245%) by 2021 compared to 2020.
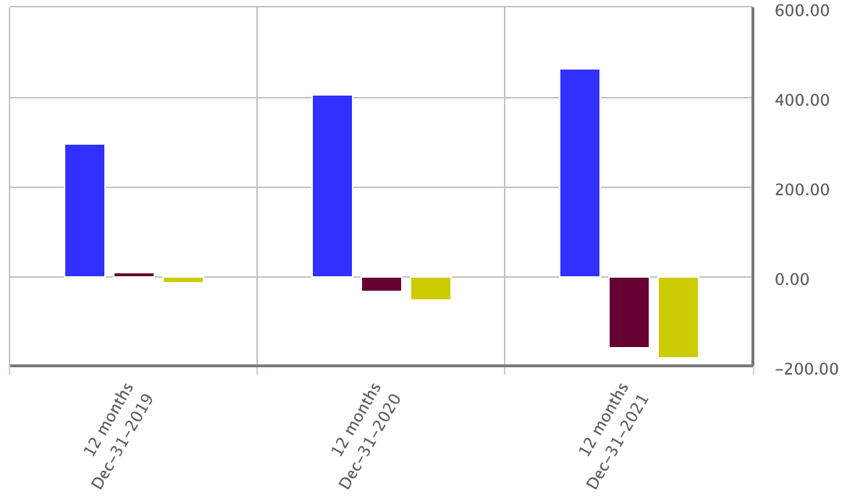
Table 1: Income Statement horizontal analysis for Beyond Meat, Inc.
Table 2: Income Statement vertical analysis for Beyond Meat, Inc.
Balance Sheet
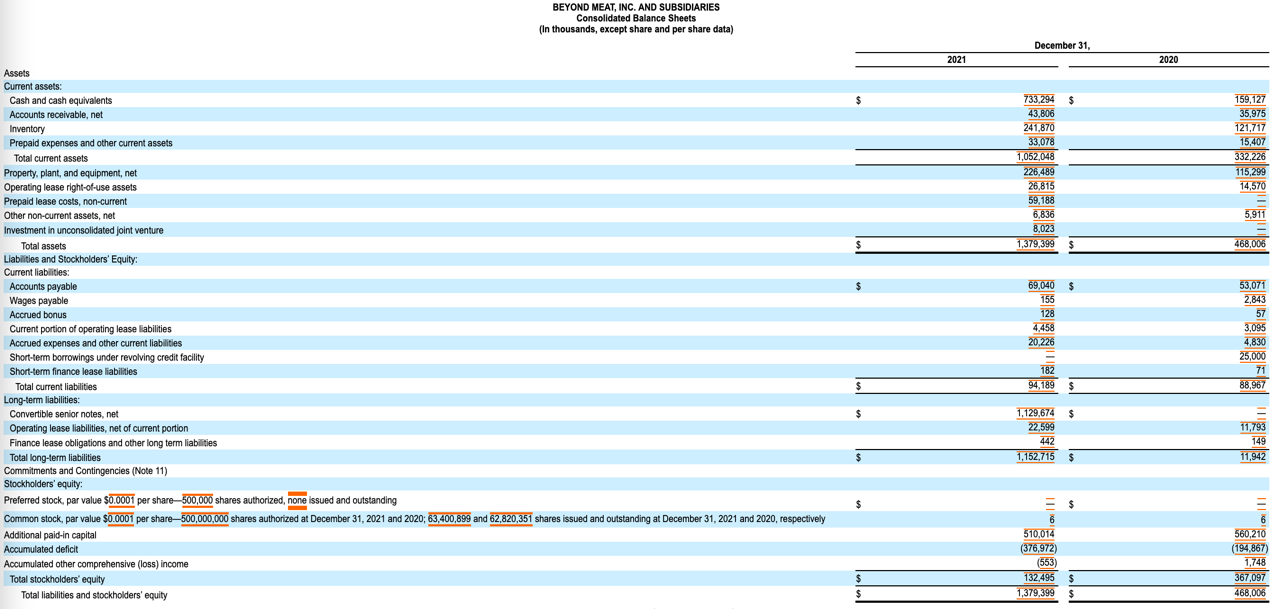
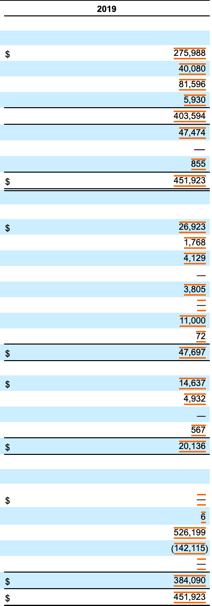
A similar analysis was done for Balance Sheets (Appendix B). Cash experienced a decline (Figure 2) and then showed a severe increase by 2021, although it is known that excess cash can be a dangerous signal for a company’s well-being (Ross, 2022). One can see from Figure 2 that the company’s total liabilities have risen strongly, which may indicate an expansionary trend in these years. Falling equity responds to the company’s increased spending, which may also be justified by expansion into foreign markets.
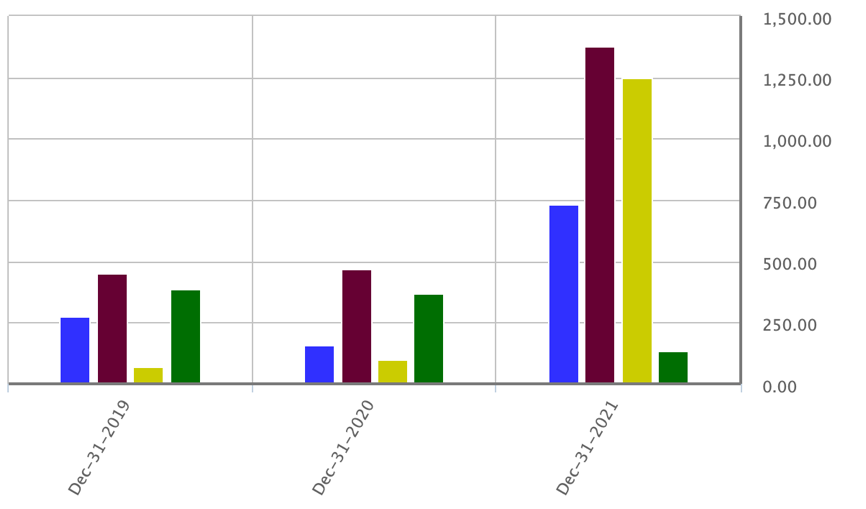
Table 3 shows the horizontal analysis for Balance Sheets for the past three years. One can see that among the significant negative changes for Beyond Meat, Inc. is a 63.91% drop in equity by 2021. The decrease could mean the company is not taking on additional debt to fund its assets. At the same time, the company has been shown to incur more losses, which also reduces the equity. Table 4 shows that the majority of the company’s capital is made up of long-term tangible assets, and by 2021 this indicator has increased, indicating the acquisition of additional assets.
Table 3: Balance Sheet horizontal analysis for Beyond Meat, Inc.
Table 4: Balance Sheet vertical analysis for Beyond Meat, Inc.
Cash Flow
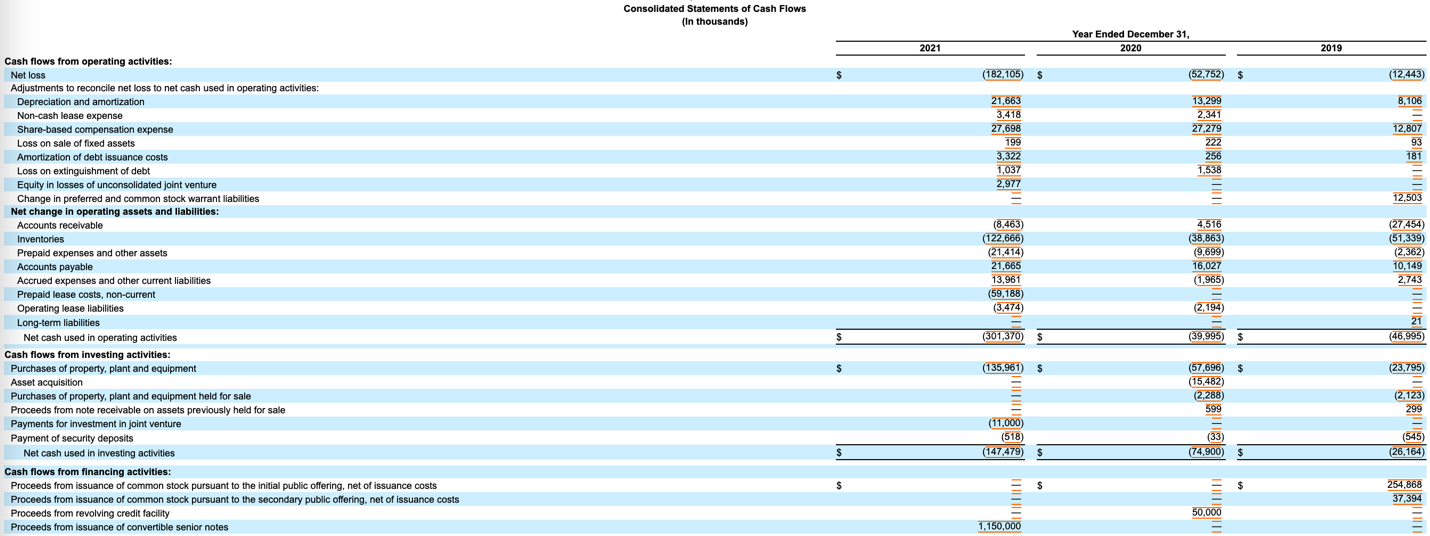
Beyond Meat, Inc. cash flows (Appendix C) show that the net change in cash and cash equivalents was struggling. At the end of 2021, the company had $574.2 million more than at the beginning (Figure 3). In 2020, Beyond Meat, Inc. had a financial outflow of $74.9 million for investing activities that continued into 2021 (an outflow of $147.5 million), indicating possible long-term investments for Beyond Meat, Inc. including potential expansion. Consequently, the company can be expected to profit from these investments in the future. The “bad” signal is a loss from the company’s business operations, confirming a departure from the break-even point. From the horizontal analysis (Table 5), it is worth emphasizing that additional funds were added to the company, increasing assets, which was reflected in an increase in net change. Given that Beyond Meat, Inc. does not pay dividends, this figure may indicate the issuance of new stock or taking out a loan to cover operating expenses. The positive change in net change in funds has especially intensified by 2021, which means it can be concluded that this is the year the company is considering expansion and development, for which additional funds are required.
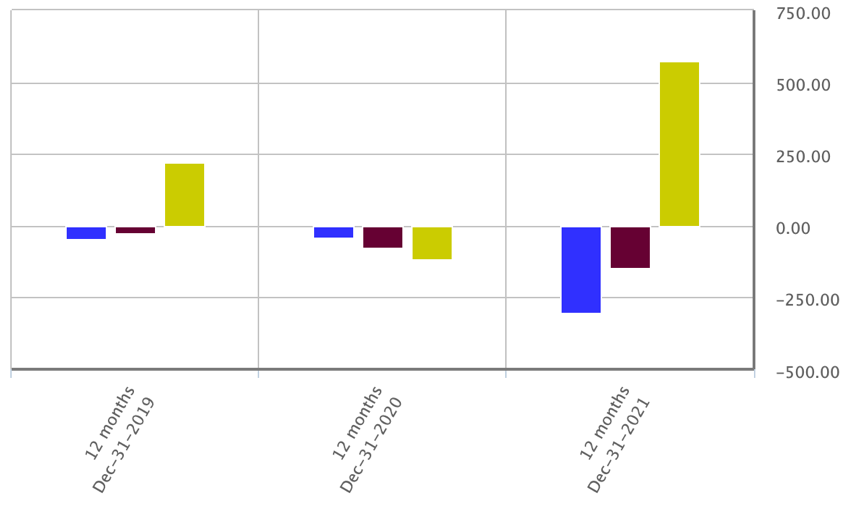
Table 5: Cash Flow horizontal analysis for Beyond Meat, Inc.
Table 6: Cash Flow vertical analysis for Beyond Meat, Inc.
Ratio Analysis
Beyond Meat, Inc. has only one competitor among those discussed in the first part of this paper that is publicly traded on the stock market, namely Maple Leaf Foods, Inc. Table 4 shows the significant economic ratios for Beyond Meat, Inc. over the past three years and identifies changes (↓ or ↑). In addition, the table compares the company to a direct competitor for each of the ratios analyzed.
Table 4: Ratio analysis for Beyond Meat, Inc. and Maple Leaf Foods, Inc.
As can be seen in Table 4, Maple Leaf Foods, Inc. has a higher ROA, ROE, ART, ITR, TAT, and PE. Higher ROA values correspond to a competitor’s greater asset efficiency, meaning Maple Leaf Foods, Inc. makes more money with less investment. At the same time, the competitor more easily transforms its equity financing into profits, and it follows that Maple Leaf Foods, Inc. is generally more accessible to make profits than Beyond Meat, Inc. (Kumar & Zbib, 2022). A higher ART value indicates that a competitor is more efficient at collecting debts from its customers and therefore has a stronger balance sheet (Amanda, 2019). Including a competitor has more robust sales, which is reflected in a higher ITR. On the other hand, the higher PE may indicate that the stock is overvalued compared to the undervalued Beyond Meat, Inc.
Meanwhile, the QR, CR, Debt-to-Equity, Debt-to-Capital, and Debt parameters are higher for Beyond Meat, Inc. A high QR value responds to the fact that the company is better able to generate money in case of emergencies than a competitor and is generally more liquid. A higher CR value indicates that Beyond Meat, Inc. has more ability to pay its liabilities. Notably, the other three metrics report high debt ratios, so one should expect Beyond Meat, Inc. (Amanda, 2019). could be in financial trouble by 2021. Given that the brand has shown an increase in revenue, this signal may suggest that the company has been actively expanding in recent years, trying to conquer new industry niches.
References
Amanda, R. I. (2019). The impact of cash turnover, receivable turnover, inventory turnover, current ratio, and debt to equity ratio on profitability. Journal of Research in Management, 2(2), 14-22.
Boyte-White, C. (2021). Operating income vs. net income: What’s the difference? Investopedia. Web.
Kumar, S., & Zbib, L. (2022). Firm performance during the Covid-19 crisis: Does managerial ability matter?Finance Research Letters, 1-10. Web.
Ross, S. (2022). The main focus points when analyzing a balance sheet. Investopedia. Web.
SEC. (2019). Beyond Meat, Inc. [PDF document]. Web.
SEC. (2020). Beyond Meat, Inc. [PDF document]. Web.
SEC. (2021). Beyond Meat, Inc. [PDF document]. Web.
