Introduction
Bomb Calorimetry is one of the methods to calculate the standard heat of the reaction of various chemical processes. One of the ways of its application is the determination of the standard heat of organic compounds, such as glucose or sucrose formation (Bomb Calorimetry: Heat of Formation of Naphthalene or Sucrose, n.d.). The formation reaction and the combustion reaction can be seen as shown below:
Equation number one shows the unknown reaction for the formation, while number two shows the known combustion reaction. The equipment used for this purpose is called a bomb calorimeter. Using the heat flow under constant volume conditions as an experimental measurable, it is possible to find Δ(PV) as follows:
ΔU = qv (3)
Where q is the Then, if the measured heat flow in the bomb equals the change in internal energy and applying the definition of enthalpy, it is possible to write the following equation:
ΔH= ΔU= Δ(PV) (4)
When the enthalpy of the combustion is determined, then we can use the heat of formation equation as follow:
ΔfH [C10H8(s)] = 10ΔHf [CO2(g)] + 4ΔHf [H2O(l)] – ΔcH (5)
Where ΔfH is the heat of the formation of naphthalene.
C = Qtot/ΔT (6)
Where C is the heat capacity of the calorimeter, Quote is the total amount of heat liberated in the calorimeter, and ΔT is the temperature change.
ΔcH = qv + Δ(PV) = -CΔT + RTΔngas (7)
Where C is the average heat capacity of the calorimeter, R is the ideal gas constant, T is the temperature change, qv is the heat released at constant volume, Δ(PV) is the difference of the PV value for the products relative to the reactants, and n is the number of moles in the naphthalene samples.
ΔH3 = nCop,m (O2)μJT(O2)(P) + nCop,m (CO2)μJT(CO2)(P) (8)
Where μJT is the Joule-Thomson, P is the pressure of the reagent, n is the stochiometric mole ratio of the reagent, and Cop,m is the heat capacity of the reagent at a constant pressure.
G.V.C = L = (W+w)(t2 – t1)/x * cal/gm
Where gm is the mass of the food sample, W is the mass of water in the calorimeter, it is 775g, w is equal to the water equivalent of the calorimeter set, which is equal to its heat capacity is 10422.11 J/oC, t2-t1 is the temperature change, and x is the mass of food sample.
Experimental Procedure
- Weight a 1-g benzoic acid pellet and place it in the fuel capsule
- Cut a 10-cm length of nichrome ignition wire and connect it to the bomb electrodes by inserting the ends of the wire in the electrodes.
- In case the bomb of air is purged, let the oxygen-filling connector into the empty bomb and leave it for a minute.
- Insert the loaded and wired bomb head into the bomb.
- Attach the O2 inlet line to the bomb’s head fitting and turn the filling knob to charge pressure of 30 atm. Remove the connection once the bomb is filled.
- Place the calorimeter bucket in the outer jacket and place the bomb in the calorimeter bucket and attach the ignition voltage supply. Add 2 L (10ml) of purified/distilled water.
- Switch on the motor that drives the stirrer and place the thermometer. Record the temperature of the calorimeter every minute.
- Ignite the sample
- Record the temperature at 30-s intervals until it begins to level off.
- Turn off the motor, remove the belt, lift the cover, and remove the ignition leads.
- Remove the bomb screw-up and examine the inside of the bomb to make sure it is clean.
- Remove the pieces of fuse wire and measure the combined length.
- Record the results by analyzing the temperature vs. time graph, which then can be useful to determine the temperature before and after combustion.
- Measure the length of the wire. Repeat the procedure from step 1 using another benzoic acid pellet.
- Check the results of the two standardization runs for consistency.
Reagents
- Benzoic Acid. Parr Instrument Co. 1g Pellets.
- Naphthalene (C10H8). 99%.
Data collected
Table 1. weight measurements used for benzoic acid and the heat Capacity values from the Two Benzoic Acid Samples.
Table 2. The heat of Combustion Values for Naphthalene.
Table 3. The calorific value of marshmallow.
Results/Discussion
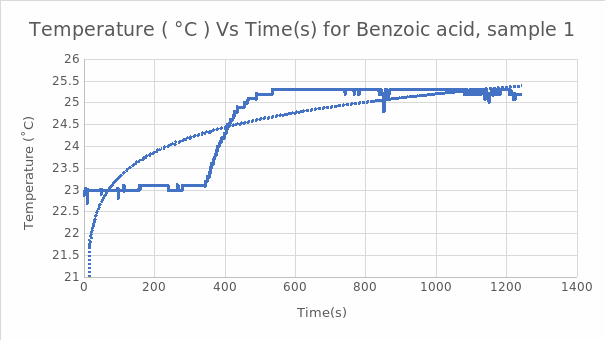
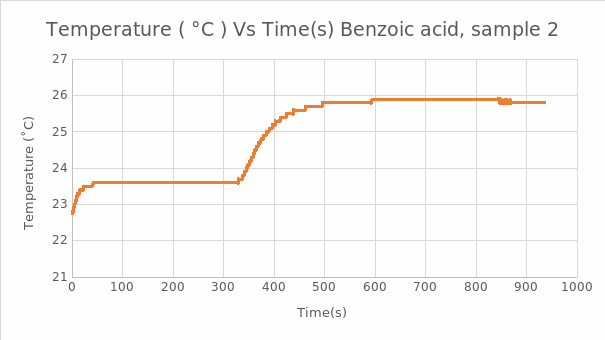
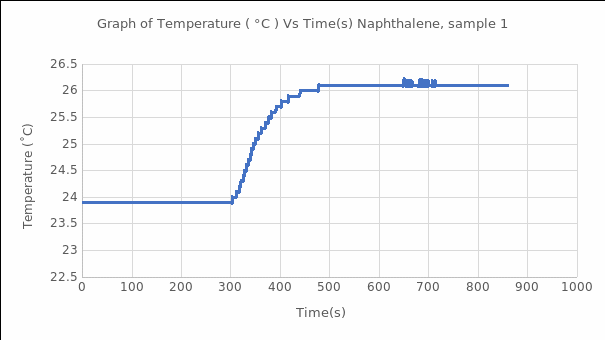
Verifying recorded temperature and time data, the results were used to develop graphs indicating the reaction path.
Table 1. Successful Sample Combustion Results.
For each of the two benzoic acid samples, the total amount of heat energy released was obtained using the following calculations:
To calculate the heat capacity of the bomb calorimeter using the data collected for the two benzoic acid reactions, we can use equation # 6 as shown in the sample calculations:

Then the mean of the two-heat capacity of the bomb calorimeter for the benzoic acid reaction was calculated as follows:
Figure 1. Graph of Temperature vs. Time for the First Benzoic Acid Sample.
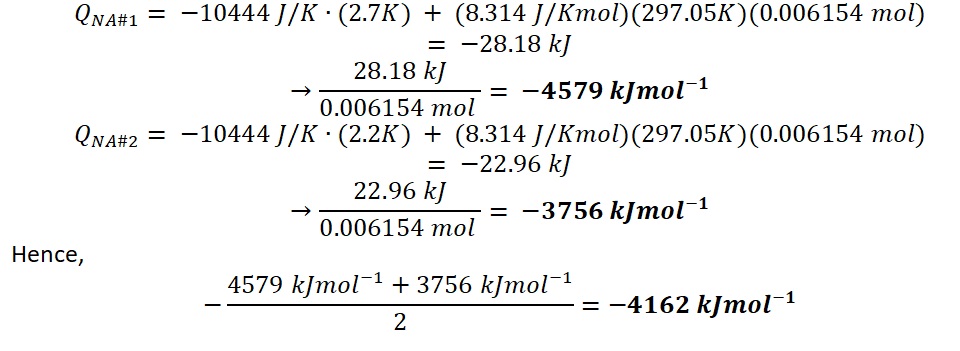
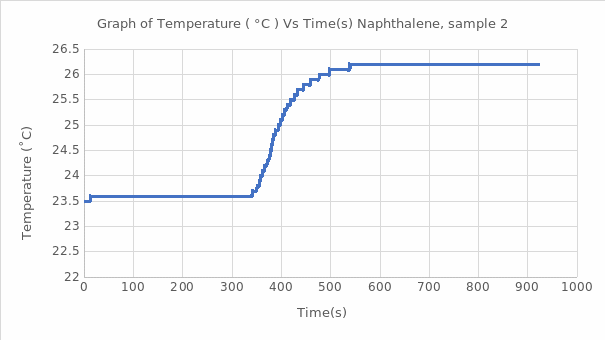
In the Naphthalene experiment, the reading was used to calculate the heat of combustion for naphthalene:
However, verification of the result obtained with the help of literature data allows us to estimate the average error of calculations. For this purpose, the standard value of enthalpy of naphthalene equal to
was used (Fischer & Wrede, 1924):
of error.
Using equation #8, we can convert the naphthalene’s average heat of combustion to standard conditions, which was added to ΔH3, which is the gas ideality, the sample calculations are as follow:
ΔH3 = 12Cop,m (O2)μJT(O2)(0bar-30bar) + 10Cop,m (CO2)μJT(CO2)(5bar-0bar)
= 12mol(29.36 J/Kmol)*(0.31 K/bar)(-30bar) + 10mol(37.11 J/Kmol)*(1.10 K/bar)(5bar)
= -1.24 kJ
However, the average heat of combustion for naphthalene was -4162 kJ/mol. Therefore, the standard heat of formation of naphthalene will be calculated using equation #5. The sample calculation is as follow:
ΔfH = 10mol(-393.52 kJ/mol)+ 4mol(-285.83kJ/mol) – 1mol(-4162 kJ/mol)
= 916 kJ/mol
In the marshmallow experiment, the calorific value is calculated by using equation # 9. The sample calculations are as follows:
For the first marshmallow sample,
= (10444 J/oC+775g)(24.7-22.6)/0.8476 = 27 796 cal/g
For the second marshmallow sample,
= (10422.11 J/oC+775g)(25.1-23.7)/1.074 = 14 624 cal/g
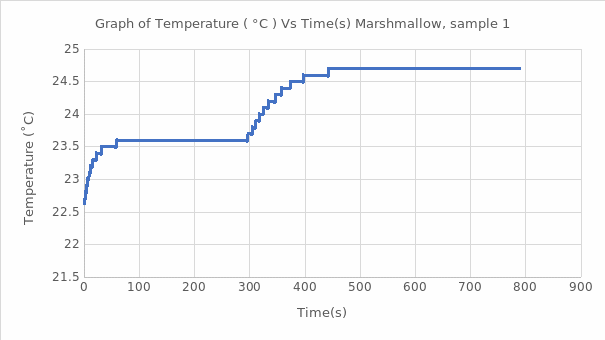
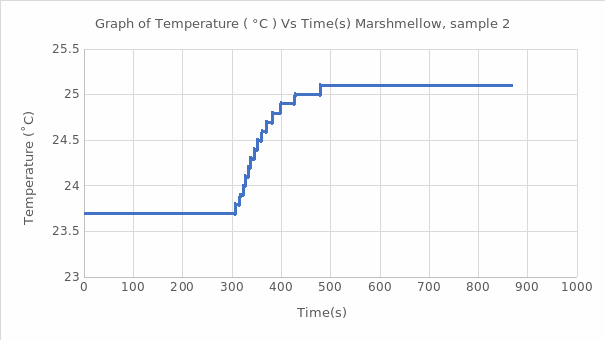
The calorimeter bomb helps to determine the calorific value of a solid, including food. Since the heating procedure of the water jacket takes place at a constant volume, the heat energy released is the change in the internal energy of the substance. In this work, using the known energy value (∆U) for benzoic acid, the calorimetric constant was calculated, averaging 10.4 kJ/℃ for this substance. Subsequently, this value was used to estimate the heat of combustion of the substance naphthalene and marshmallow samples in this work. The processes studied reflected exothermic reactions, which means that additional heat was generated during the combustion of these reagents and marshmallows. It is well seen that each of the graphs of the function of temperature as time correctly reflects the expected theoretical trend: it is a jump-like increase in temperature during the transition of the substance from the ignited state to the steady state. Such thermodynamic behavior is characteristic of combustion reactions of organic matter with the destruction of bonds between atoms. The total value of the heat of combustion for naphthalene was found to be -4162
, which differs by 20% from the reference literature data (Fischer & Wrede, 1924). Consequently, the result obtained in the paper was not entirely accurate, but the resulting error was not critical. Most likely, one source of the error accumulation was the inability to create completely adiabatic conditions because heat from heating the water jacket could still escape through the walls of the tank. Additional potential sources of error could have been reagent measurement errors on the scales or the introduction of a metal wire whose internal energy could have been ignored.
Conclusion
To summarize, modern bomb calorimeters help to study the term kinetics of combustion reactions, which makes sense for studying the internal energy of substances. Benzoic acid was used as a standard to study the calorimetric constant and combustion heats of naphthalene and marshmallow. A final comparison of the results for naphthalene with literature data showed the existence of an error of twenty percent. On this basis, and with an understanding of the potential causes of such error, it becomes possible to say that the experiment conducted was generally successful. In the end, it allowed the competence in the use of the calorimetric bomb method to be established academically.
Reference
Ammar, M.M.; El Sayed, N.; Morsi, S.E. & El Azmirly, A. (1977).The enthalpies of combustion and formation of p-tertiary butyl phenol and naphthalene, Egyptian Journal of Physics: 8, 111-118. Web.
Bomb Calorimetry: Heat of Formation of Naphthalene or Sucrose. (n.d.).
Fischer, E., & Wrede, F. (1924). Über die Verbrennungswärme einiger organischer Verbindungen. Untersuchungen aus Verschiedenen Gebieten, 413-435.