Qualitative Attributes
The following qualitative attributes may become the focus of attention when promoting the Wonderbar (an energy bar):
- Taste (possible changes: making a sweet alternative; introducing spicy flavors, etc.);
- Smell (the intensity thereof must be evaluated);
- Texture (perhaps, a new design may become a bigger success).
At present, the organization has been known among the target audience primarily due to the success of its energy bars. Furthermore, it is assumed that the bars should be marketed as the company’s brand product. Therefore, there is a strong chance that the specified product will be the focus of attention. However, it is important to introduce innovative approaches to marketing, which means that the brand product may need slight rebranding. Particularly, including new flavors and textures may be a necessity. Thus, the opinions of the target audience about the current taste, smell, and texture will have to be taken into account (Rolls, 2015).

Ordinal Attributes: Names
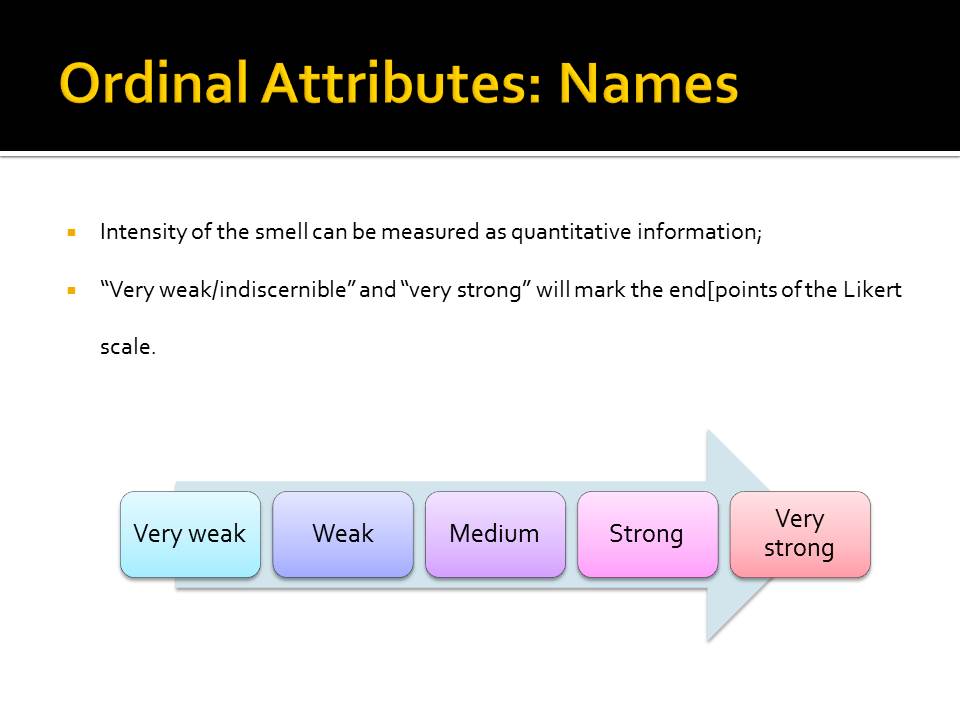
- Intensity of the smell can be measured as quantitative information;
- “Very weak/indiscernible” and “very strong” will mark the end[points of the Likert scale:
- Very weak;
- Weak;
- Medium;
- Strong;
- Very strong.
The intensity of the smell can be viewed as ordinal data. Therefore, a 5-point Likert scale will have to be introduced to evaluate the issues that the target audience may have with the product (Cheung, Fong, & Zhang, 2014). Thus, an elaborate rating scale should be designed.
It should be noted that it is not the pleasantness of the smell but its intensity that will be assessed. The former characteristic is barely quantifiable and can hardly be evaluated at all because of huge differences in the preferences of the population.
It is suggested that the endpoints of the scale should be marked as “very weak/indiscernible” and “very strong.”
Difference between Ordinal and Nominal Data
- Nominal data provides qualitative characteristics (e.g., color, taste, etc.);
- Ordinal data provides quantitative characteristics (e.g., height, weight, volume, etc.);
- On a rating scale, nominal data is evaluated by measuring the relevant ordinal data.
The difference between ordinal and nominal data is rather basic. Nominal data provides the description of specific variables without making any references to the related quantitative information. Ordinal data, on the contrary, focuses exclusively on the numerical information and provides the foundation for statistical analysis.
Both ordinal and nominal data types are linked to a rating scale. Particularly, the latter allows determining the intensity of the nominal data by using the ordinal data as the basis for the analysis. Therefore, when using a rating scale, one must bear in mind that ordinal and nominal data types are inseparable, and, thus, they provide the foundation for an all-embracing assessment (Schwartz, Wilson, & Goff, 2013).
Quantitative Attributes
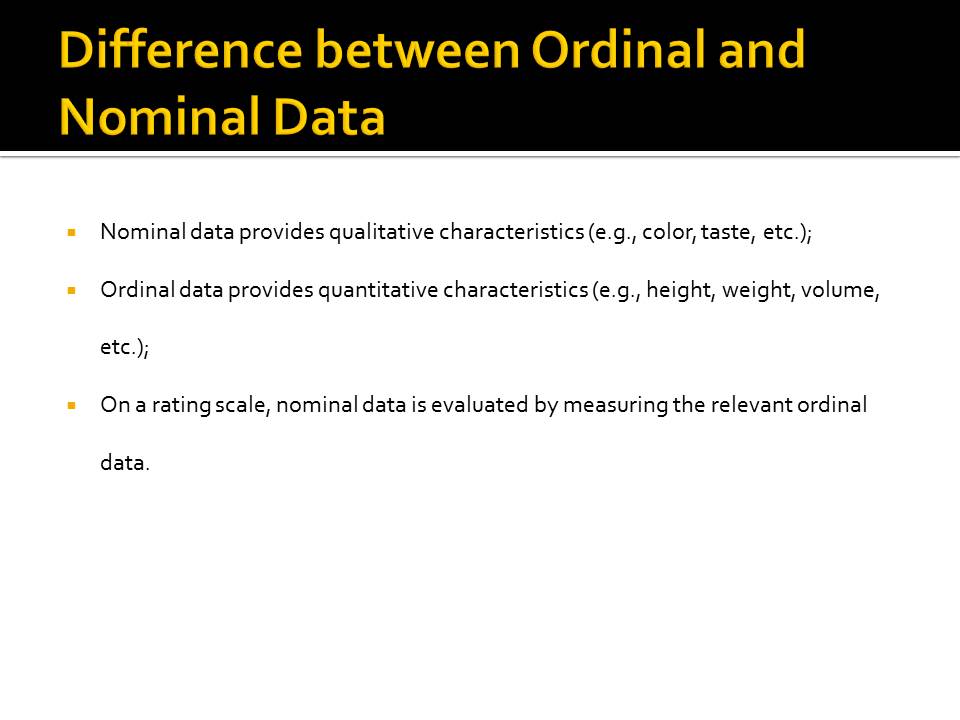
- Number of calories in an energy bar;
- Ratio between the carbs, fats, and proteins in an energy bar.
Snack food has attracted a lot of attention of scientists over the past few decades. The effects that it has on the human body have been explored extensively to identify the best diet and determine the balance between different types of nutrients. Therefore, quantitative information about snacks is also required.
The number of calories per energy bar can be considered the primary quantitative attribute into which scientist might want to look. Thus, the effects on consumers’ health can be determined and improved. Afterward, the fats, carbs, and proteins ratio will have to be considered for possible future improvements.
By using business intelligence, which is an efficient management of data, one will be able to determine the trends in the customer demand and, thus, rebrand the product successfully (Sherman, 2014).
Interval and Ratio Data: Difference
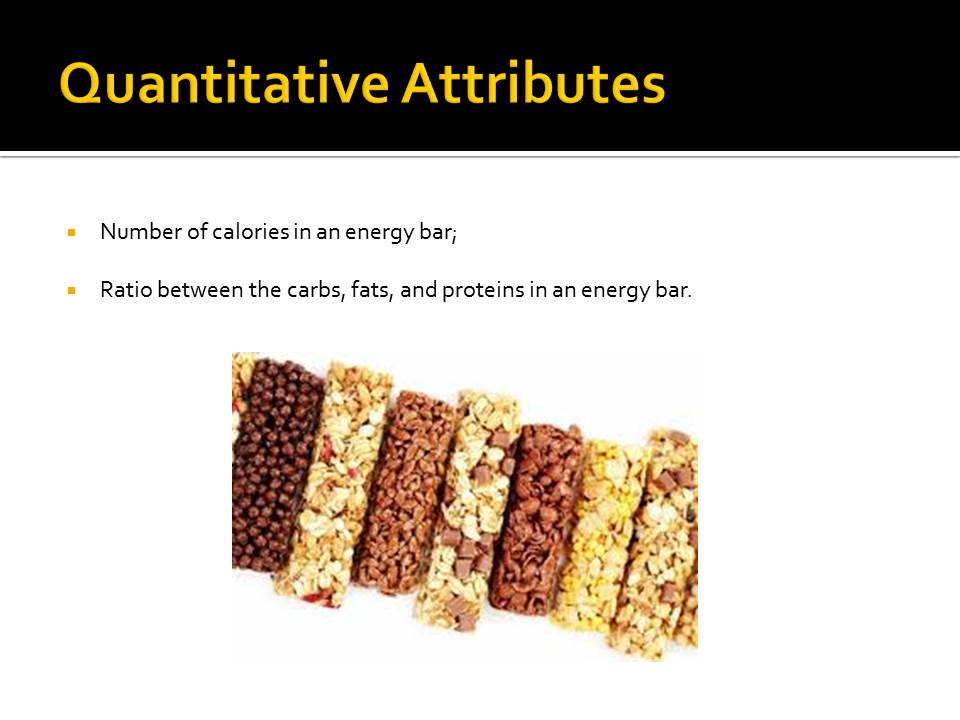
- Interval data allows measuring intervals between the variables;
- Ratio data allows:
- determining the ratio;
- between the variables that;
- have a value other than 0.
The difference between ratio data and interval data is rather basic. By definition, interval data can be measured on a scale with the following calculation of the difference between the provided variables. The temperature-related examples are the most common ones. For instance, using F°, C°, or K°, one may measure the difference between the temperatures of the Sun (5,772 K°) and Alpha Centauri (5,790 K) to determine that AC is 0.018K° hotter. However, to take the ratio of the two values, one will have to consider using ratio data, which suggests that the zero value does not exist. For instance, 50K° is five times as hot as 10K°, yet variable A cannot be 0 times as big or small as variable B (Goos & Meintrup, 2015).
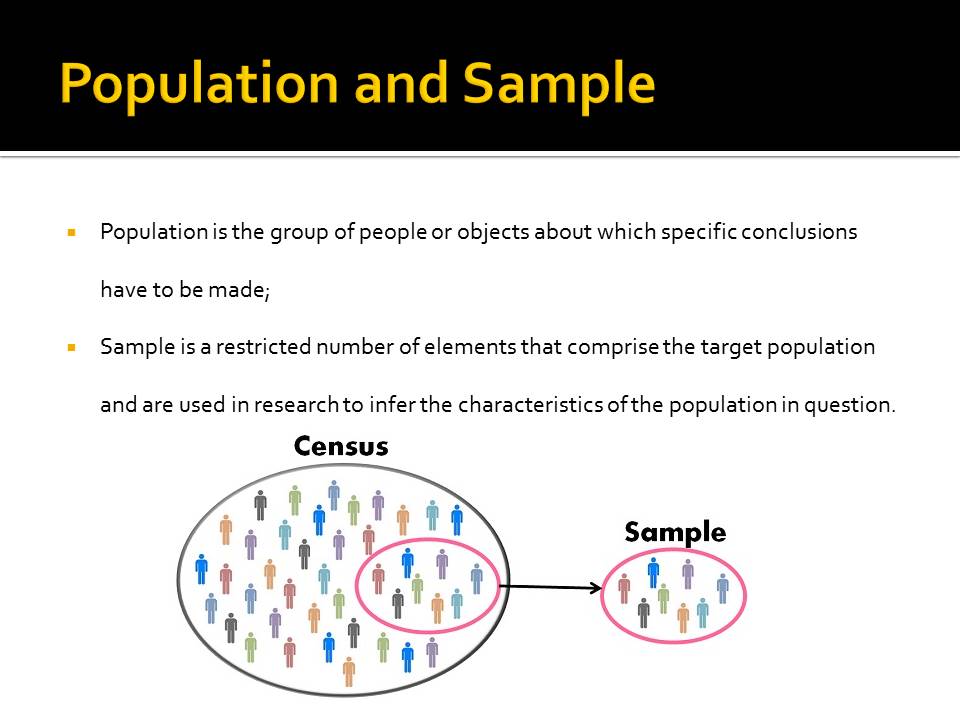
Population and Sample
- Population is the group of people or objects about which specific conclusions have to be made;
- Sample is a restricted number of elements that comprise the target population and are used in research to infer the characteristics of the population in question.
While a population involves all people or items that the research targets to study, a sample is the number of participants that represent the population. Therefore, a population may be viewed as a large whole, whereas a sample only provides a few specimens from the population (Riff, Lacy, & Fico, 2014).
References
Cheung, S. K. S., Fong, J., & Zhang, J. (2014). Hybrid learning theory and practice. Shanghai: ICHL.
Goos, F., & Meintrup, D. (2015). Statistics with JMP: Graphs, descriptive statistics and probability. New York, NY: John Wiley & Sons.
Riff, D., Lacy, S., & Fico, F. (2014). Analyzing media messages: Using quantitative content analysis in research. New York, NY: Routledge.
Rolls, E. T. (2015). Psychology of taste and smell. International Encyclopedia of the Social & Behavioral Sciences, 24(1), 26-31.
Schwartz, B. M., Wilson, J. H., & Goff, D. M. (2013). An easy guide to research design and SPSS. Thousand Oaks, CA: SAGE Publications.
Sherman, R. (2014). Business intelligence guidebook: From data integration to analytics. New York, NY: Newnes.