Objects, Attributes, and Methods
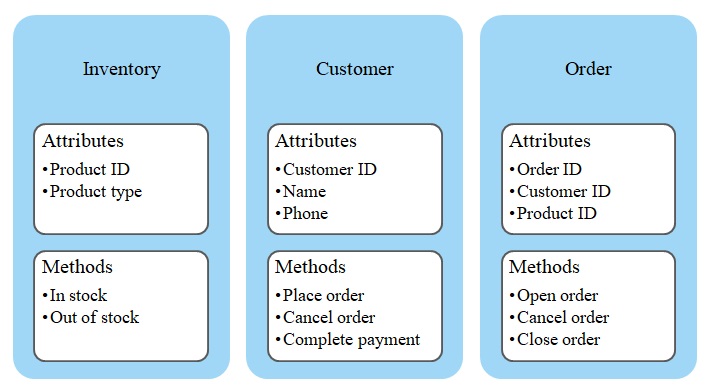
The databases for the bike shop should contain information about the goods, parts, customers, employees, as well as orders and invoices that the store handles. These data are interconnected – for instance, when the owner or an employee wants to see a customer’s profile, they will also be able to look at this client’s active and closed orders. All parts of data are related with the help of unique ID numbers. The three examples of objects, as well as their attributes (descriptors) and methods (possible behaviors), are outlined below (Ojha, Tiwari, Kadam, & Khot, 2017).

Use Cases and Actors
The actors in this scenario can include customers and all employees of the firm. Clients place orders, pay for goods, and receive them; they can also cancel the order or contact the company if something is wrong with their bike. Next, sales representatives are responsible for communicating with customers and documenting requests for mechanics and service helpers to complete, also initiating financial operations. Third, the mechanic working at the shop is another actor who is responsible for repairing bikes and investigating them to find problems. In the system, one of the three use cases is order creation (which moves from the customer or the sales representative to the mechanic). The second is the creation of an invoice that is made using the information about the customer, inventory, and order. Finally, if the company can update inventory information – update prices, list new items and manage stock.
Use Case Diagram
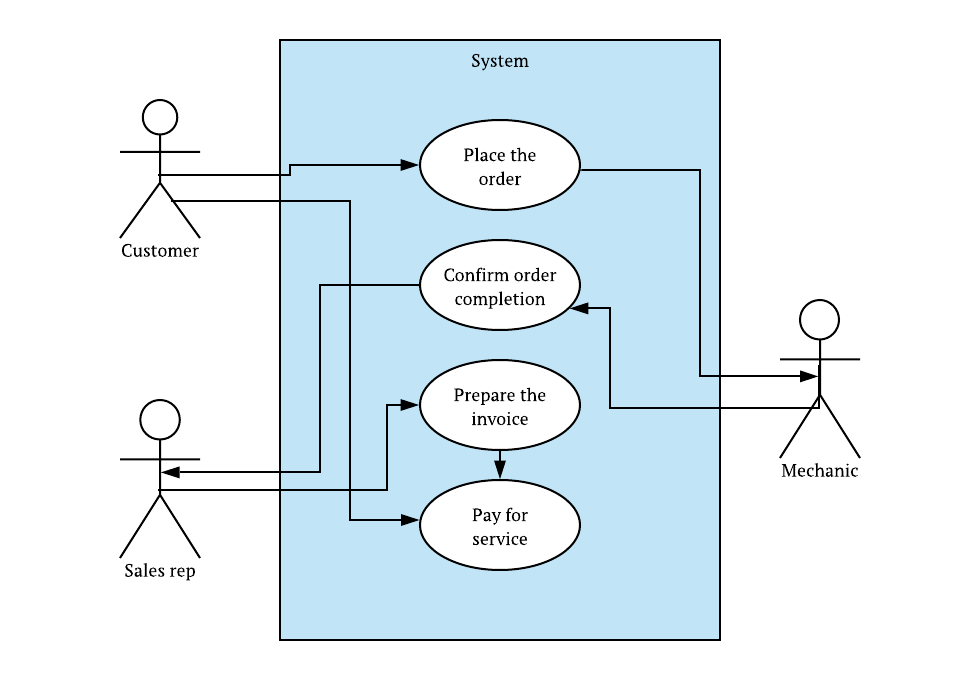
The use case diagram is used to show how people perform specific tasks in order to complete a use case scenario. The diagram for service requests is displayed below – the rectangle represents the computerized system in which all tasks will be performed either manually or automatically. In most situations, use case diagrams include such elements as:
- an actor (a human-shaped figure – the person performing the action);
- a use case (an oval – one step);
- an association (an arrow – the connection between the actor and use case);
- a boundary for the system (a rectangle – the uniting environment) (Aleryani, 2016).

The diagram shows that the customer is responsible for placing the order, although this action can be completed by the sales representative if it is done inside the shop. The mechanic receives the request, and the system cannot automatically complete it since the process of repair is not automated. When the mechanic manually confirms the completion, the sales representative can start preparing the invoice, which is then presented to the customer who pays for the work.
State Transition Diagram
The state transition diagram is needed to show all statuses in which any customer can be in relation to placing and closing orders in the bike shop. First of all, any person that is not registered in the system is the first state – nonexistent customer. Then, with the opened account or any collected information about the client and sales opportunity, the new customer is created. When the client orders a bike, they become an active customer – from here, they can complete the order or cancel it. Moreover, they may request for the mechanic to look at their bike, whether it is newly purchased or old. Inactive customers do not make purchases at the moment or at all.

References
Aleryani, A. (2016). Comparative study between data flow diagram and use case diagram. International Journal of Scientific and Research Publications, 6(3), 124-126.
Ojha, A., Tiwari, R., Kadam, K., & Khot, K. (2017). Web application development with object oriented programming. International Journal of Scientific Research in Computer Science, Engineering and Information Technology, 2(2), 1013-1019.