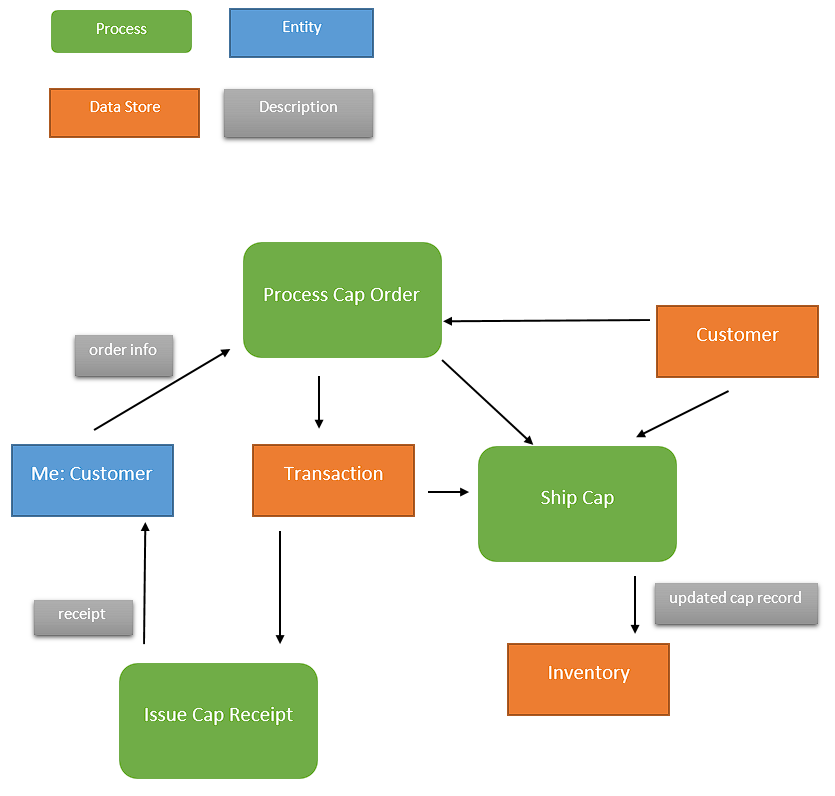
Ordering a cap for the graduation is the most likely transaction I will encounter in the near future. The mapping process of the data flow in a transaction is an important concept to be knowledgeable about, which is why visualization can be powerful. Diagraming a data flow is useful due to the fact that it brings structure and organization to a complex set of processes, such as ordering a cap for graduation.
A high-level data flow diagram or DFD can be accessed in Figure 1 below. A DFD “maps out the flow of information for any process or system. It uses defined symbols like rectangles … to show data inputs, outputs, storage points and the routes between each destination” (Lucidchart, 2022, para. 1). When it comes to my choice, I selected this transaction because it is easy to understand, complex enough to build a DFD, and relevant in the context of graduation. I think that DFD offers an opportunity to build a critical insight into data systems and how data flows between the systems and entities as well as processes. In the case of the diagram below, Figure 1 uses four labels, such as differently colored rectangles for entities, data stores, processes, and descriptions in the diagram.
In conclusion, I think that utilizing a high-level DFD or a context diagram can be useful when working with information systems, where design and analysis are critical. It is important to note that DFDs bring a degree of organization and structure to the complex set of data flows between several entities and processes. In other words, the diagram offers a novel method of visual communication for both technically proficient and non-technical audiences.

Reference
Lucidchart. (2022). What is a data flow diagram?Web.