Dubai’s auto industry has shown significant growth and stability in the past years. This makes it a viable industry to invest. However, it is important to understand the characteristic of the industry to ensure profitable investment. The aim of this report is to present an overview of Dubai’s car market. The information presented in the report will serve as a map, guiding the decisions of players in the auto industry. The findings in this research are based on an investigation into current and possibly future customer preferences of motorists in Dubai while making car purchase decisions. There has been an increase in the purchase of secondhand vehicles in Dubai (HSBC, 2013). This research will investigate the factors that influence the prices of cars. Considering the increase in secondhand vehicle choices amongst consumers, the study will focus on identifying the relationship between preferred vehicle price and car mileage.
Research methodology
The research is performed by identifying and analysing different analyzable data. Secondary and primary data are sourced for effective analysis. It is important to understand Dubai’s auto industry from the perspective of already concluded research before delving into the current study. Secondary data will summarise different findings concerning Dubai’s auto industry. The variables included in the primary research study will be a product of findings in the secondary data.
The primary data for this research study was collected through a survey of Dubai residents. The targets data related to the participants’ car preferences. The questionnaire will be distributed online and will be developed in such a way that repos ends can easily respond to the questions. All questions included in the questionnaire will be close-ended to derive results that are easily analyzable. The links to the questionnaire will be emailed to the participants and they may respond to the questionnaire at their convenience. The link will be closed after three weeks and 50 fully completed questionnaires will be collected and analysed.
The analysis will try to relate the participants’ car preferences with their demographics. The first title in the questionnaire (Target Market) comprises the independent variables, which include gender, age group, and income. The other titles are the dependent variables. By correlating respondents’ demographics, with their preferences, cost expectations, and their buying decisions, the demographic market that fits the different car types can be identified. Conclusions will be drawn from the outcomes of the analyses.
Dubai’s automotive market overview
Numerous articles and surveys focus on reviewing Dubai’s auto mobile industry (Jafza, 2013).It will be difficult to state the exact methods and results of each survey and research concerning Dubai’s auto industry. However some important points were drawn from a review of these studies.
Firstly, trends indicate that vehicle users in Dubai are preferring second hand cars (Jafza, 2013). A 40% growth in sales of second cars was recorded in 2013 only. This is an indication of consumers’ preference of cars in this category. Most of the second hand cars purchased by consumers, fall under the saloon/sedan category. The shift to second hand cars is influenced mainly by pricing (Jafza, 2013). Customers seek cheaper options when trying to purchase vehicles, and they price these second hand cars according to the car mileages (Jafza, 2013).
Findings and Data analysis
Target Market
The first part of the questionnaire investigated the demographics of the participants. The following charts summarises participants’ characteristics.
Gender
One of the variables considered for the user demographics was gender. The survey explored the gender variation the participants because of the importance of gender as a demographic. Understanding the gender distribution of the participants will help the researcher conclude if the results are inclined towards only a specific gender or if they are applicable for both male and female consumer. The table breaks down the percentage distribution with respect to gender. The results show that 54% of the participants were male, while 46% of them were female. While the results of the study will be more applicable to male consumers, the distribution is quite balanced.
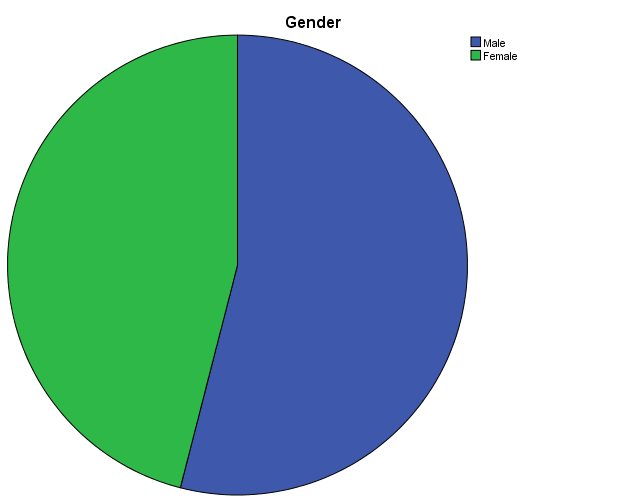
The chart illustrates the distribution. It is obvious that the blue segment, which represents male participants, is larger than the green segment. This shows the presence of more male, than female participants.
Age Group
Age is another important characteristic in demographic analysis. The participants’ age distribution was considered in the survey. Understanding the age distribution of the participants will help the researcher conclude if the survey results are applicable towards only a specific age group or if they are applicable for consumers in the different age groups. The table breaks down the percentage distribution with respect to participants’ age groups. The results show that majority of the participants are within the 20 to 44 years of age. This age group is sufficient for the analysis of the results since most vehicles users would fall within this age group.
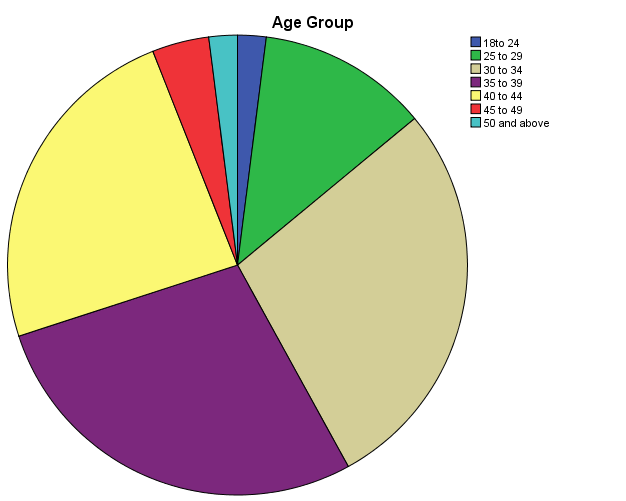
The pie chart above is an illustration of the participants’ age group distribution. The brown, purple and, yellow segments of the chart are the largest and represent participants between 30 and 44 years.
Annual Remuneration
The purpose of selling cars is to make profits. Thus, it was necessary to consider the financial abilities of potential consumers. The following table highlights the distribution of the of the participants’ annual earnings in USD. The participants’ responses indicate that majority of the participants earn between 100000 to 150000 USD annually. It will be necessary to consider this when pricing the product.
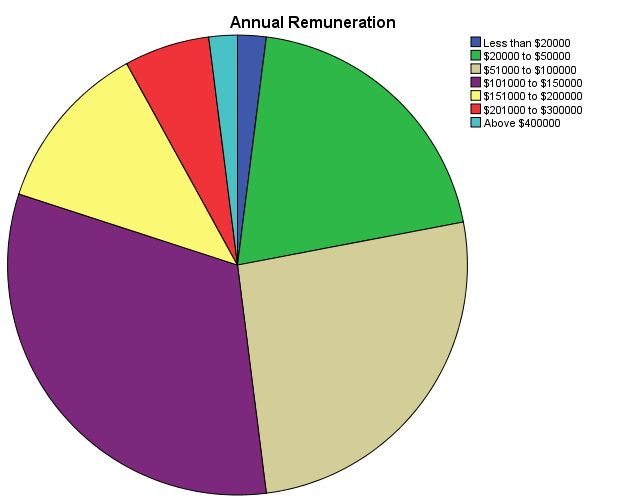
The pie chart illustrates the distribution of the participants’ annual earning. The outcome of the research shows that majority of the participants earn between 51000 and 150000 USD annually, represented by the brown, purple, and green segments of the pie chart. The pricing of the products should therefore focus on this group.
Consumer Preferences
The previous section of the report summarized the demography of the participants. The current section investigates consumers’ preferences when purchasing cars. Consumers have different preferences and it is important to investigate them.
Preferred Car Type
Different classes of cars are produced and distributed in the market. It will be irrational to choose a car class to release in the market, without first identifying the preferred car type. This informed the need to investigate consumers’ car preferences when making buying decisions. The results, shown in the table below, indicate that saloons/sedans are the most preferred types of cars amongst the participants. 68% of the participants preferred saloons/sedans.
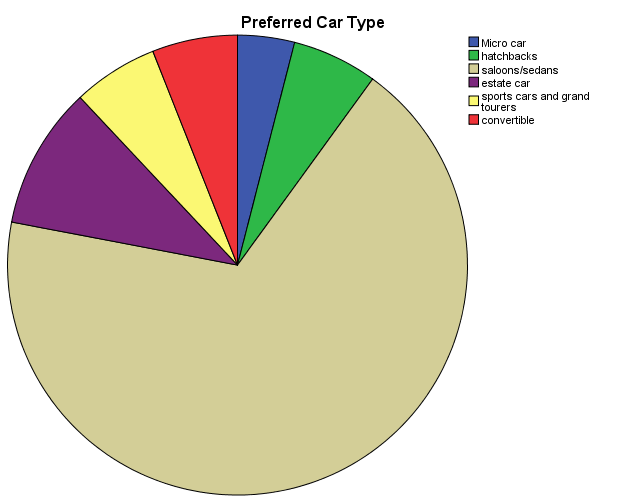
The pie chart above illustrates the distribution of the participants’ preferred car types. The outcome of the research shows that majority of the participants (68%) prefer saloons/sedans, represented by the brown segment of the pie chart. The management should focus on release cars that fall under this category when targeting the marketing.
Preferred Car Pricing
As earlier, pricing is an important aspect of marketing. It is important to understand customers’ willingness to purchase a product at a particular price, before pricing the product. The participants chose their preferred type of cars. This question asked the participants to state the price range that was most rational for the car type they selected. The participants’ responses is summarised in the table below. Majority of the participants (46%) suggested that cars should be priced from 6001 to 9000. 20% of the participants said cars should be priced from 9001 to 12000.
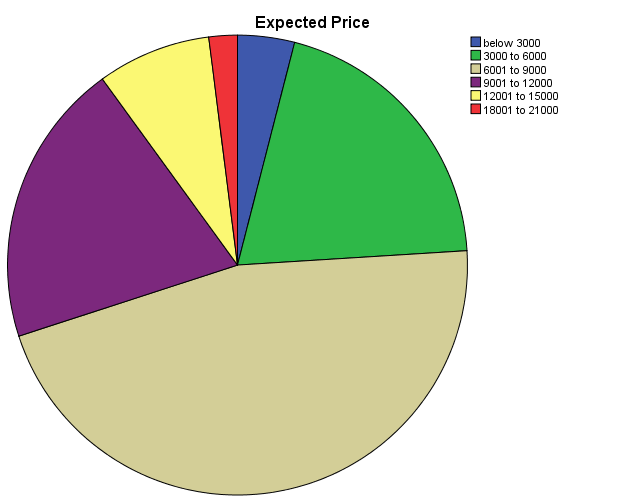
The pie chart above illustrates the distribution of the participants’ preferred car prices. The outcome of the research shows that majority of the participants (56%), represented by the brown and purple segments of the pie chart, think cars should be priced from 6000 to 12000. The company should put this into consideration when releasing cars into the market.
Factors influencing Consumer Choices
Various factors may influence a consumer’s choice to purchase a car. It is important to understand the preferences of consumers in Dubai’s auto market in order to effectively position the cars to be sold. The questions investigated the factors that influenced participants’ car decisions the most.
Pricing
Price was the first factor to be considered. Participants were asked if they considered a car’s price when making buying decisions. 86% of the respondents agreed that the price of a car played a major role on their buying decision. 34% of these participants strongly agreed that pricing was important.
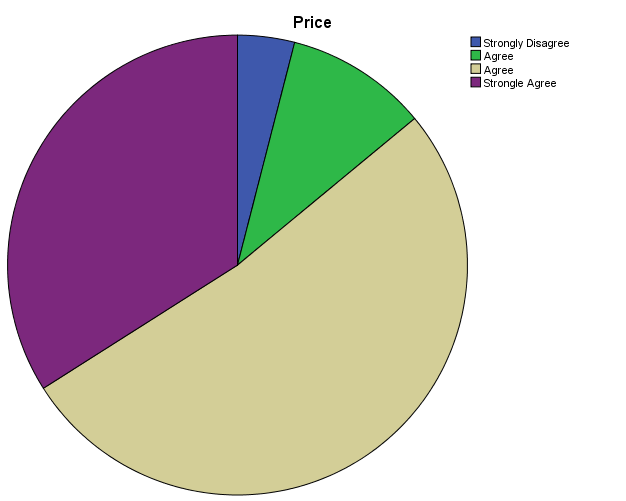
The pie chart above illustrates the distribution of the participants’ perception of the importance of a car’s price in influencing their choice. The outcome of the research shows that majority of the participants (86%) agree that pricing is important (brown and purple segments of the pie chart). 34% (illustrated in the purple segment) strongly agree that car pricing is very important.
Fuel Consumption
Consumers also consider a car’s cost of maintenance. Fuel expense is an important maintenance cost. Participants were asked if they considered a car’s fuel consumption when making buying decisions. 90% of the respondents agreed that the fuel consumption of a car played a major role on their buying decision. 36% of these participants strongly agreed that fuel consumption is an important factor.
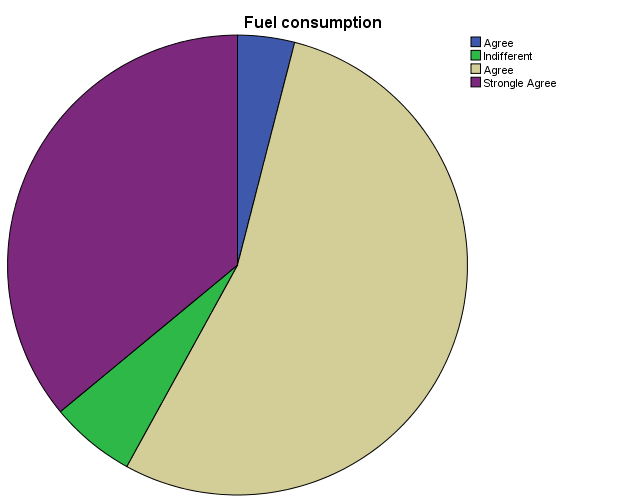
The pie chart above illustrates the distribution of the participants’ perception of the importance of a car’s fuel consumption, in influencing their choice. The outcome of the research shows that majority of the participants (90%) agree that fuel consumption is important (brown and purple segments of the pie chart). 36% (illustrated in the purple segment) strongly agree that fuel consumption pricing is important.
Car Size
The size of a car may influence customer’s perception of a car. Participants were asked if they considered a car’s size when making buying decisions. 82% of the respondents were indifferent. 16% strongly disagreed and 2% agreed that car size was an important factor influencing their buying decisions.
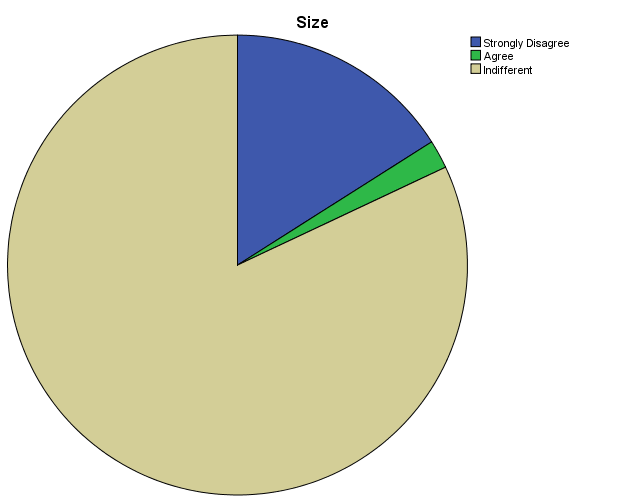
The pie chart above illustrates the distribution of the participants’ perception of the importance of a car’s size, in influencing their choice. The outcome of the research shows that most participants (82%) are indifferent about a car’s size (brown segment of the chart). 10% (illustrated in the purple segment) disagree that car size is an important factor influencing their buying choice.
Payment Affordability
Car companies may offer affordable payment methods to attract consumers to their products. The payment affordability of a car may influence customer’s perception of a car. Participants were asked if they considered the affordability of the payment options when making buying decisions. 76% of the respondents were indifferent, 20% strongly disagreed, and 4% agreed.
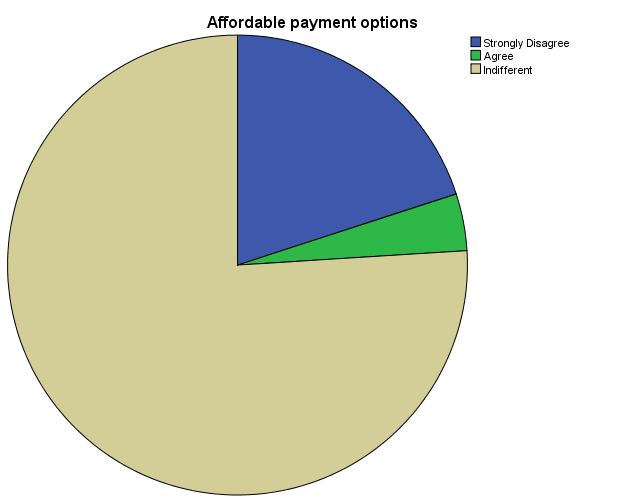
The pie chart above illustrates the distribution of the participants’ perception of the importance of payment affordability on their choice. The outcome of the research shows that most participants (76%) are indifferent about a car’s size (brown segment of the chart). 20% (illustrated in the purple segment) strongly disagree that car payment option flexibility is an important factor influencing their buying choice.
Effect on Environment
The eco-friendly nature of a car may influence customer’s perception of that car. Participants were asked if they considered how environmentally friendly a car was, when making buying decisions. 70% of the respondents disagreed, with 28% out of them strongly disagreeing.
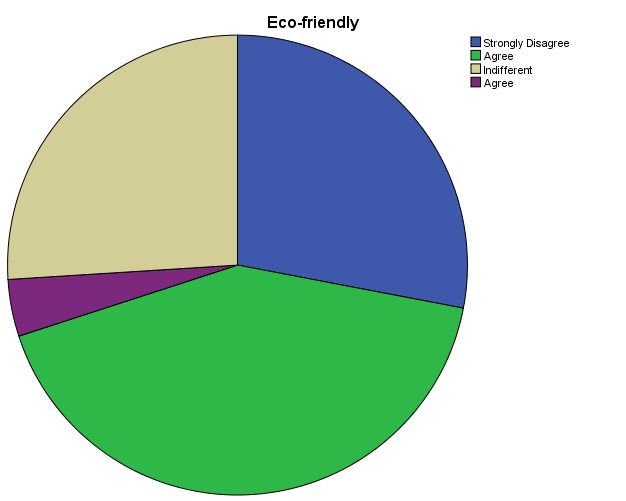
The pie chart above illustrates the distribution of the participants’ perception of the importance of environmental effects of a car on car their choices. The outcome of the research shows that most participants (28%) strongly disagreed that they consider a car’s effect on the environment when making their choices.
Luxury
The luxurious nature of a car may influence customer’s perception of that car. Participants were asked if they considered how luxurious a car was, when making buying decisions. Most (36%) of the respondents were indifferent. However, a considerable number (20%) strongly agreed that they would consider the luxurious nature of a car when making their buying decisions.
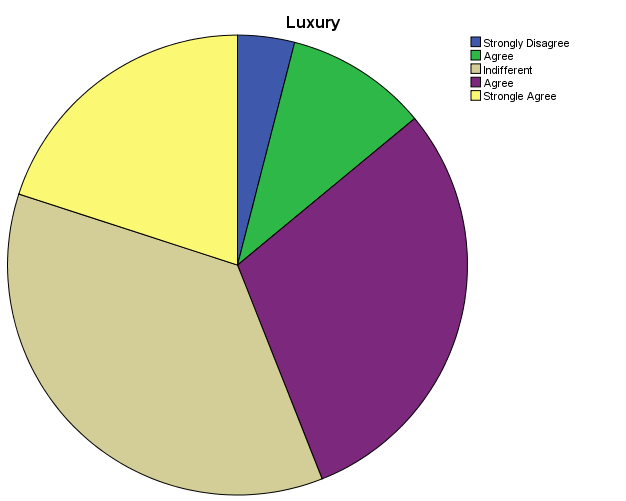
The pie chart above illustrates the distribution of the participants’ perception of the luxurious nature of a car on their choices. From the distribution, it is observed that most of the participants are indifferent about luxury. However a considerable number of consumers consider luxury as being very important (illustrated in the yellow segment of the pie chart).
Techy-Nature
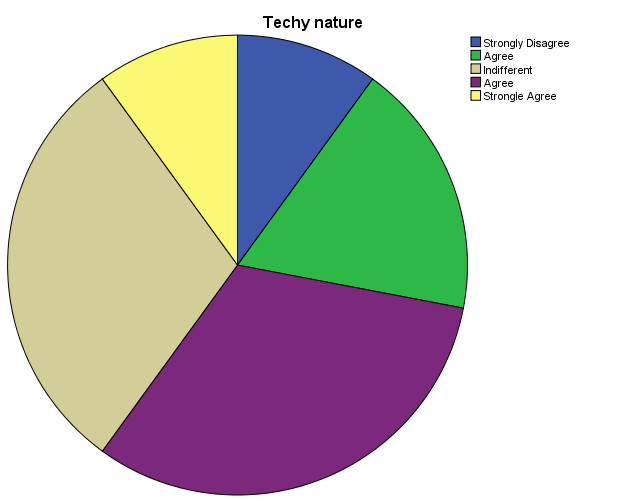
The techy nature of a car may influence customer’s perception of that car. Participants were asked if they considered how techy a car was, when making buying decisions. Most (30%) of the respondents were indifferent. However, a considerable number (32%) agreed that they would consider the techy nature of a car when making their buying decisions. The pie chart of the distribution is presented under the table.
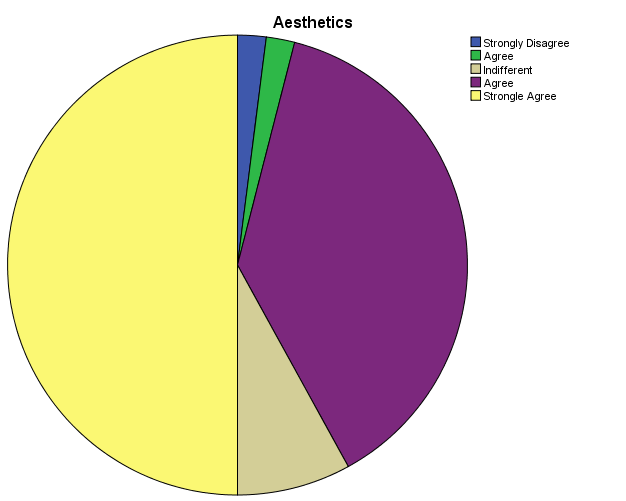
Aesthetics
The aesthetics of a car may influence customer’s perception of that car. Participants were asked if they considered the aesthetic value of a car, when making buying decisions. Most (50%) of the respondents were strongly agreed. Another 38% of the consumers agreed that they would consider the aesthetics of a car was an important factor to consider when making buying decisions.
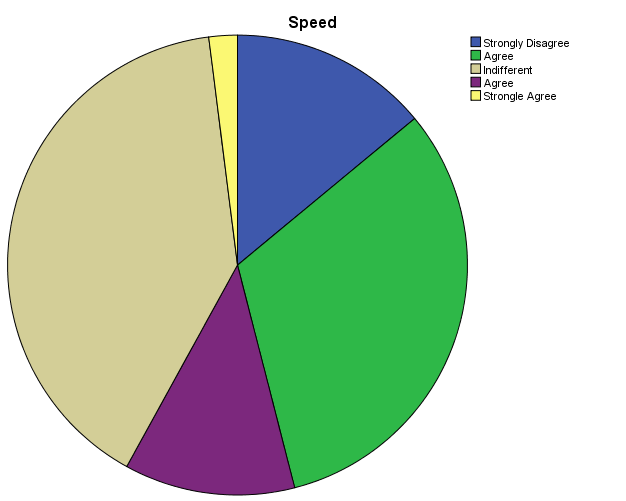
Speed
The performance of a car (in terms of its speed) may influence a customer’s perception of that car. Participants were asked if they considered a car’s speed, when making buying decisions. Most (40%) of the respondents were indifferent. However, a considerable number (32%) disagreed that they would consider a car’s speed as an important factor when making their buying decisions.
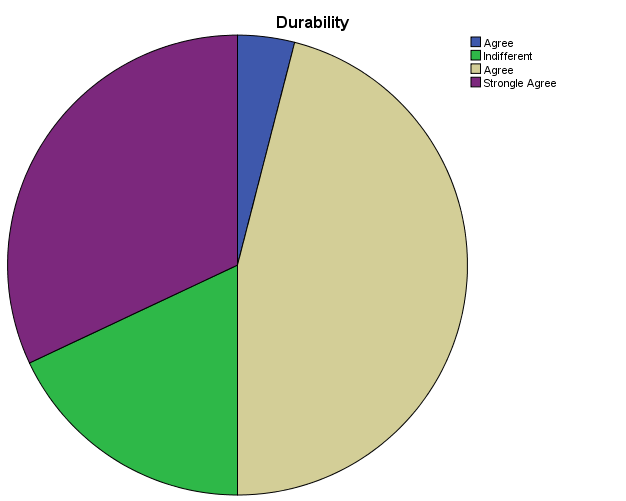
Durability
The durability of a car may influence customer’s perception of that car. Participants were asked if they considered how durable a car was, when making buying decisions. Most (46%) of the respondents agreed that durability was an important factor. 32% of the respondents strongly agreed that they would consider the durability of a car when making their buying decisions.
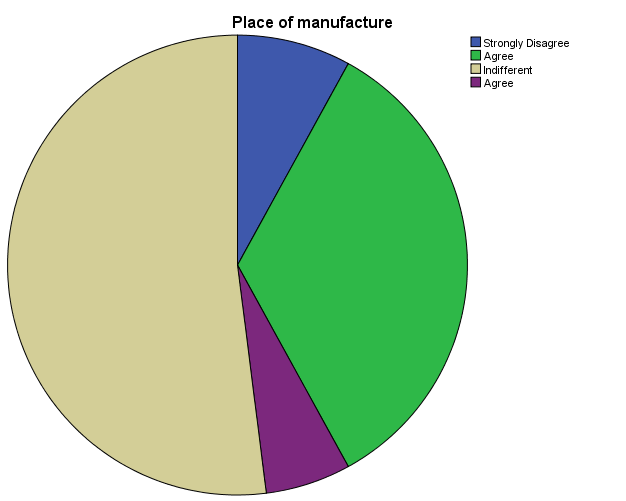
Place of Manufacture
The location a car was produced may influence customer’s perception of that car. Participants were asked if they considered the manufacturer’s location, when making buying decisions. Most (52%) of the respondents were indifferent. However, a considerable number (34%) strongly disagreed that they would consider the location of the manufacturer, when making their buying decisions.
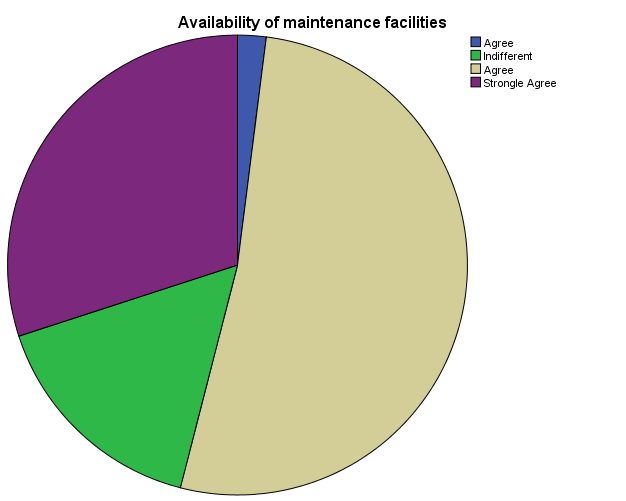
Availability of Maintenance Facilities
The availability of a car’s maintenance facilities may influence a customer’s perception of that car. Participants were asked if they considered the availability of maintenance facilities in their location, when making buying decisions. Most (52%) of the respondents agreed that there was need for maintenance facilities in the Dubai.
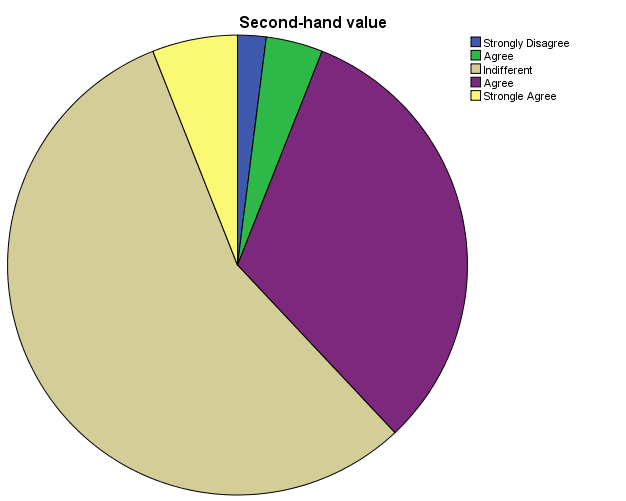
Second hand Value
The second value of a car may influence customer’s perception of that car. Participants were asked if they considered how a car’s second value, when making buying decisions. Most (56%) of the respondents were indifferent. However, a considerable number (32%) agreed that they would consider the second value of a car when making their buying decisions.
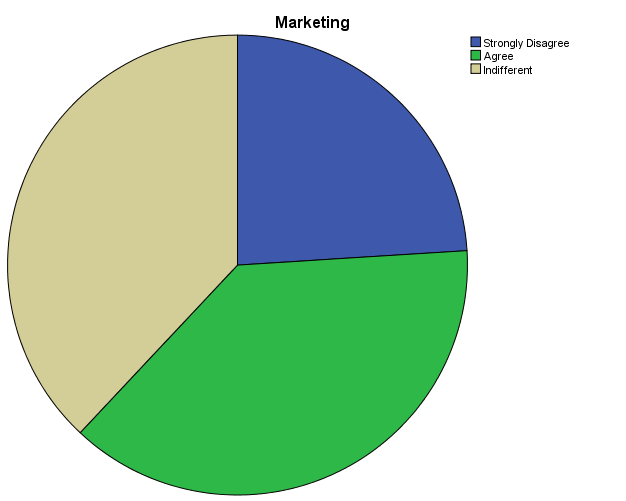
Marketing
A company’s marketing strategy may influence buyers’ purchasing choices. Participants were asked if they considered a manufacturer’s marketing strategy, when making buying decisions. No participant agreed. Most (38%) of the respondents were indifferent while the rest disagreed.
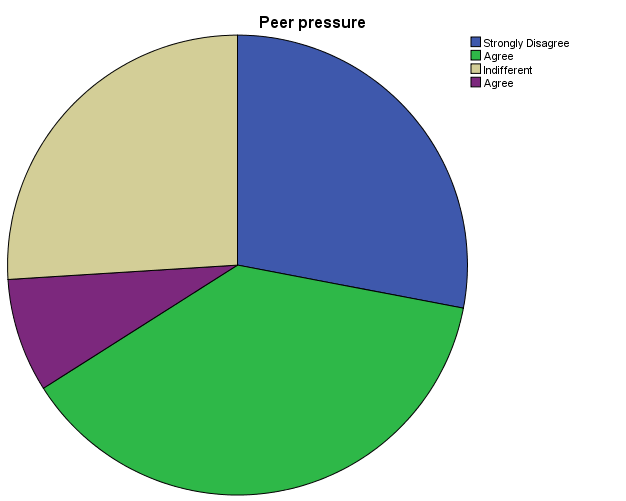
Peer Pressure
Peer pressure may be a factor influencing buyers’ choices. Participants were asked if they were influenced by their peers, when making buying decisions. The results were distributed. This may be because peer pressure is a personal trait that people respond differently to.
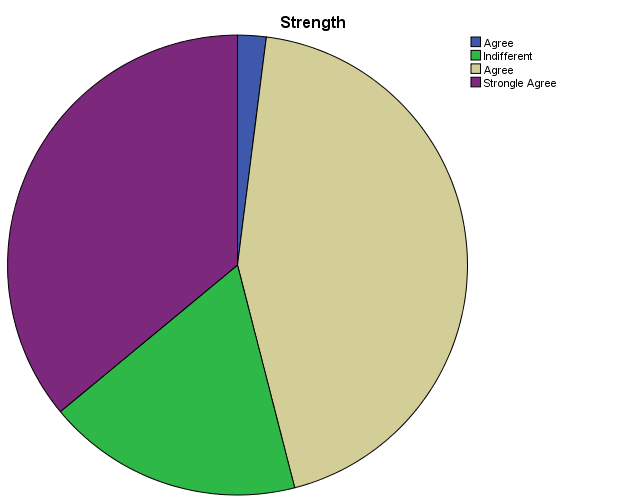
Car Strength
A car’s strength may influence customer’s perception of that car. Participants were asked if they considered how strong a car was, when making buying decisions. Most (44%) of the respondents agreed that strength was an important factor. 36% of the participants strongly agreed that they considered car strength when making buying decisions.
Correlation Analysis: Relationship between Mileage and Pricing
The secondary and primary data indicate two interesting points. The secondary data shows that second hand cars have become popular in Dubai. The primary data on the other hand shows that consumers consider pricing as a very important factor when making their purchasing decisions. While second hand car value is measurable through mileage, pricing can be measured through different price ranges. A correlation analysis was performed to identify the relationship between mileage and car price. Consumers were asked to select the ideal price range for the car types they selected in relation to the car mileage. A total of 11 price ranges and five different mileage ranges were considered. The mileage ranges were 0, 50000, 100000, 120000, 140000, 150000, and 200000. The price ranges were and their respective coded values were as follows
1 = <3000
2 = (3000 to 6000)
3 = (6001 to 9000)
4 = (9001 to 12000)
5 = (12001 to 15000)
6 = (15001 to 18000)
7 = (18001 to 21000)
8 = (21001 to 23000)
9 = (23001 to 26000)
10 = (26001 to 29000)
11 = (30000 and above)
A correlation analysis, through a scatter plot diagram, was used to identify the relationship between vehicle mileage and preferred price. The figure below is an illustration of the outcome of the scatter plot diagram.
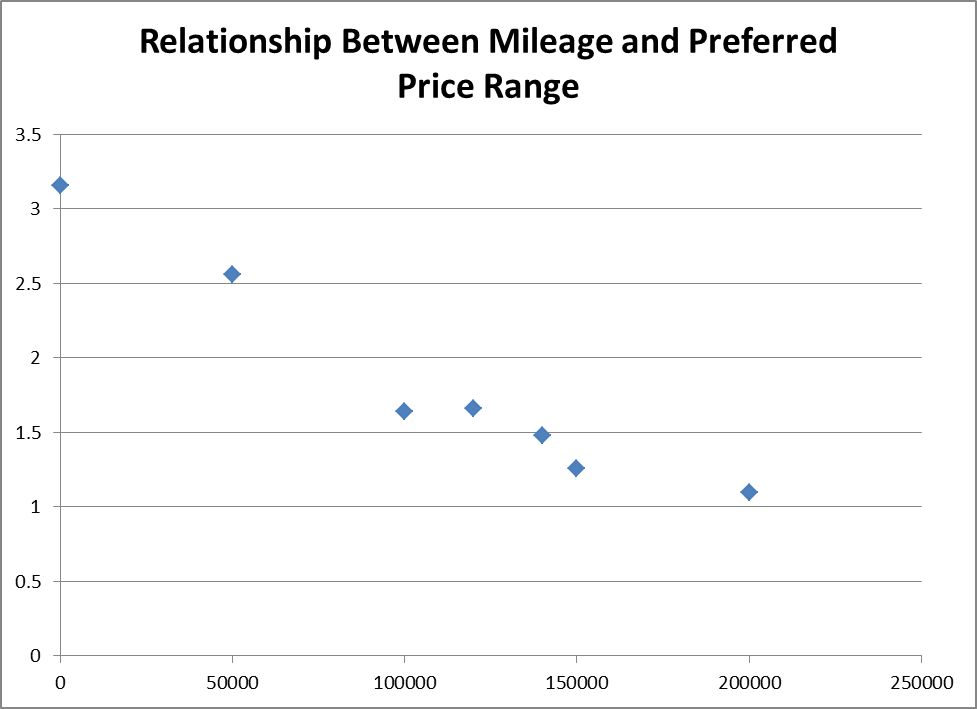
From the figure above, there is an inverse relationship between vehicle mileage and consumer preferred price. Thus, the higher the vehicle mileage, the lower a customer is willing to pay for the vehicle.
Conclusions and Limitations of Research
The aim of this research was to investigate the preferences of vehicle users in Dubai’s auto market. Secondary data were used to identify the trends in Dubai’s auto industry. The secondary data indicated that vehicle users in Dubai preferred used cars to new cars. However, it was important to identify other factors that users may consider, when making their purchasing choices.
A survey was conducted to identify consumer vehicular needs. The outcome of the survey indicated the pricing was the strongest factor influencing consumer choices. It became necessary to relate current trends with consumer needs.
A correlation analysis, through a scatter plot diagram, comparing second hand cars with consumer preferred pricing, indicated that consumer preferred price is inversely proportional to vehicle mileage. It is recommended that the company releases second hand saloon/sedan into the market and price these cars according to cars’ respective mileages.
The limitation of this research was that the sample population considered is rather small. It is important to consider the preserve of a wider population when performing such marketing surveys.
References
Caplin, A & Leahy, J 2010, Economic theory and the World of Practice: a celebration of the (S,s) model, Journal of Economic Perspectives, vol. 24 no.1, pp.12-24.
Gerhard, W & Gottfried, V 2002, Transactional information systems: theory, algorithms, and the practice of concurrency control and recovery, Morgan Kaufmann Press, South Melbourne.
Jafza, S 2013, Middle East automotive market projected to grow 20% yearly over next five years, Gulf News, Web.
Joshi, G 2013, Management information systems, Oxford University Press, New Delhi.
Laudon, C & Laudon, P 2009, Management information systems: managing the digital firm, Prentice Hall, New York.
O’Brien, J 1999, Management information systems–managing information technology in the internet worked enterprise, McGraw-Hill, Boston Irwin.
Sora, K Kai, L Min, K & Hee-Dong Y 2012, A multilevel analysis of the effect of group appropriation on collaborative technologies use and performance, Information Systems Research, vol. 23, no. 1, pp. 214-230, Web.