Introduction
The data analysis examines the relationship between race and ethnicity of children officially classified as poor. Two states, Arizona and California, as well as the national level, according to Kids Count (2003), are chosen for analysis. Three peer-reviewed articles that are unrelated to the research question are analyzed. Moreover, potential trends and dependencies of changes in such indicators are examined to look for correlations between homeownership earnings levels and the ethnic composition of families. The purpose is to confirm that the racial composition of families shows correlation with child poverty through inspection of the data.
Data and Source Description
The data are taken from a source that continuously documents the information and relates it to established earnings levels in an annual format. For example, in 2021, the poverty threshold for a family of four was $27,479, and percentages are reported for children under the age of 18 living in households with incomes below that threshold (Kids Count, 2023). However, poverty status is not calculated for institutionalized children or those living in military barracks. The data are summaries of income information from the previous year before the surveys. According to Kids Count (2023), these summaries are derived from official sources, including analysis of data from the U.S. Census Bureau, the Population Reference Bureau, and the American Community Survey for the years used in the tables. Preference is given to percentages for the reason of greatest relevance in the context of comparing regions.
Data Trends
A graphical embodiment of the indicators observes the general trends and dynamics of the obtained data. The period is chosen from 2011 to the most current confirmed data received in 2021, with a total size of ten years. Thus, it is possible to look at changes in the situation at both the state and national levels (Fig. 1). Ethnic and racial groups are highlighted for a more objective approach: American Indian, African American, Asian and Pacific Islander, Hispanic or Latino, White, and two or more races family combinations (Fig. 2). Because of this division, the differences and trends in the number of children belonging to families below the poverty line are most evident.
The updated information for the two states is shown in pie chart format with the cumulative percentages. It means that the entire pie does not represent 100%, but is a method of displaying the proportions of the population affected in Arizona (Fig. 3) and California (Fig. 4). In addition, a summary of ethnicity information at the federal and state levels is examined to understand the overall situation (Fig. 5). By visualizing the information, it is possible to note the large proportion of marginalized racial groups in difficult financial situations (Briggs et al., 2022). Moreover, it becomes possible to identify trends and analyze such data more thoroughly.
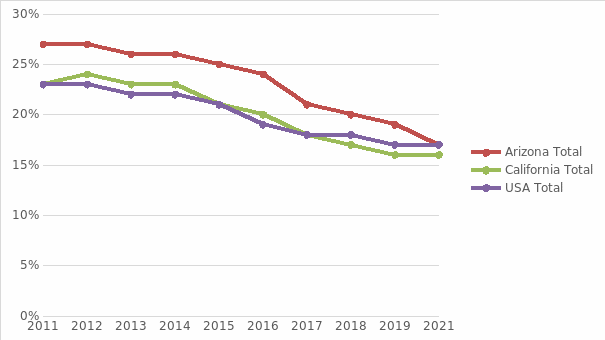
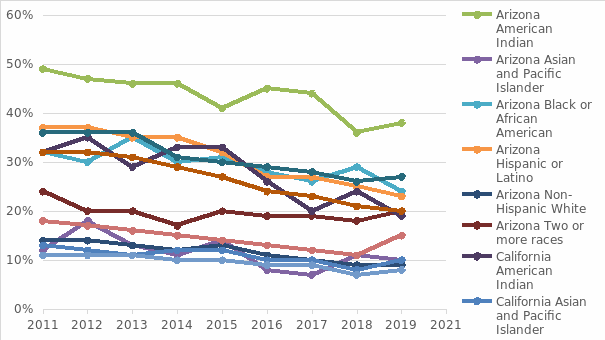
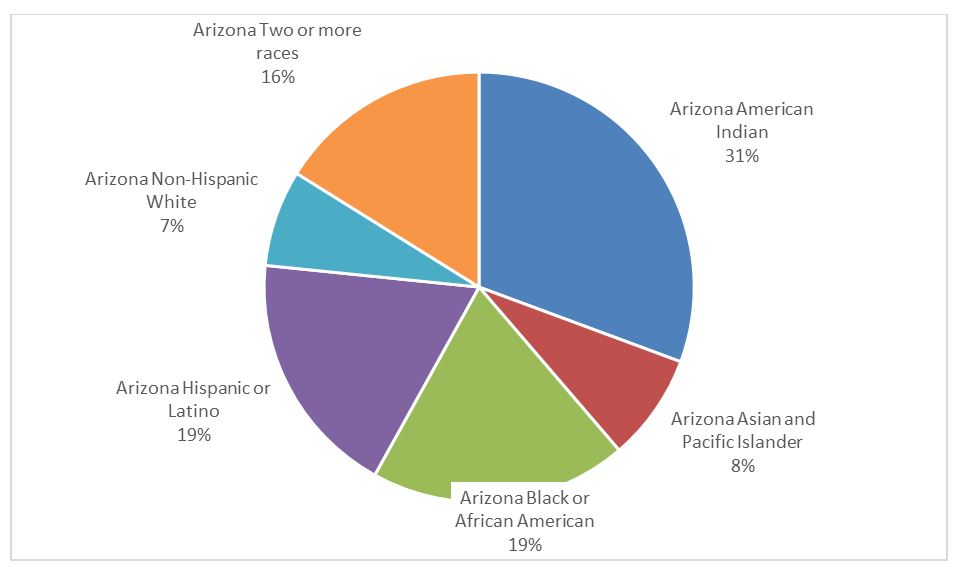
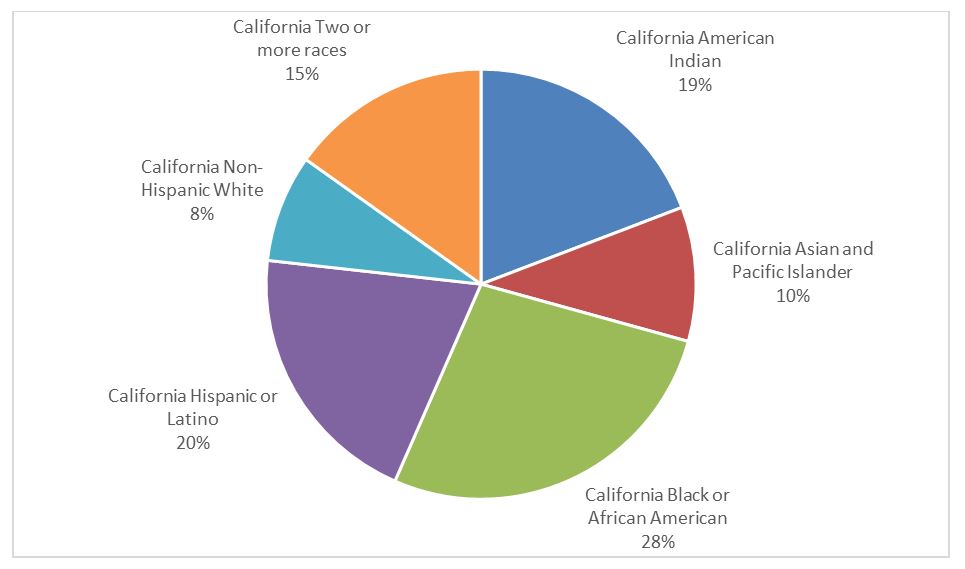
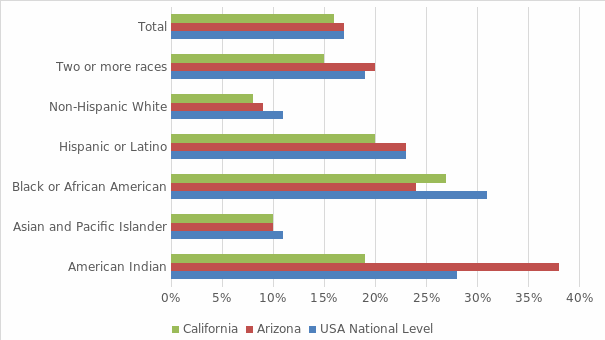
Arizona has a significant problem with the number of children in families below the poverty line, which tends to decrease and converge with national levels. At the same time, a very high percentage of such children belong to families of American Indian ethnicity, and this rate is not declining fast enough to stand out from the general state background. At the same time, California’s rate is much lower and shows a functional decline while remaining one of the leading rates across the state (Kids Count, 2023). Overall trends can be defined by a desire for declining rates and rising incomes for all households, but have a difficult period in late 2019-2020 that can be attributed to the economic and social crisis caused by the pandemic.
Summary of Relevant Articles and Discussion
The articles selected for correlation are directly relevant to the issue at hand. Briggs et al. (2022) examine the determinants of inequality and disproportionality of African American children in the child welfare system. In addition to poverty, the important role of racism in shaping these children’s experiences is pointed out. It is suggested that not only income but likewise intra-social relations need to be addressed to reduce the percentage of child poverty. Parolin et al. (2022) look at a broader category of ethnic minority children using longitudinal data. The article argues that child poverty results from low economic opportunities during adolescence. The authors propose policies to reduce child poverty that should focus on economic empowerment and anti-discrimination. Van Gorp and Vyncke (2021) look at the problem of implementing such policies using Belgium as an example. Deproblematization, or rethinking social problems, should lead to greater awareness of child poverty and increase levels of social participation.
In the context of examining the data, the problem of racial differentiation and lower living standards for children from ethnic minorities becomes apparent. This fact arises due to fewer opportunities for such households and the legacy of segregation and discrimination (Briggs et al., 2022; Parolin et al., 2022). Thus, the downward trend in the percentage of poverty is related to public and political work related to equality and is complicated by global economic crises. The significant difference between the states of Arizona and California suggests the importance of increased activism to combat the problem at all levels in Arizona.
Conclusion
The connection of problem to the race and ethnicity of families becomes evident when looking at child poverty rates and signals the presence of inequalities in society. Low income, lack of access to education, and residential segregation contribute to these high poverty rates among marginalized communities. Policies need to be actively developed to address this problem and strive for the goals of sustainable development in civilized societies.
References
Briggs, H. E., Huggins-Hoyt, K. Y., Teasley, M. L., & Hopps, J. G. (2022). Poverty or racism? Determinants of disproportionality and disparity for African American/Black children in child welfare. Research on Social Work Practice, 32(5), 533–538. Web.
Kids Count data center from the Annie E. Casey Foundation. (2023). Kids Count. Web.
Parolin, Z., Matsudaira, J., Waldfogel, J., & Wimer, C. (2022). Exposure to childhood poverty and racial differences in economic opportunity in young adulthood. Demography, 59(6), 2295–2319. Web.
Van Gorp, B., & Vyncke, B. (2021). Deproblematization as an enrichment of framing theory: Enhancing the effectiveness of an awareness-raising campaign on child poverty. International Journal of Strategic Communication, 15(5), 425–439. Web.