Research data for the research problem were developed as follows:
The coding of members of the surgical unit was 1 for the surgeon and 2 for other surgical team members, including surgical technologists and the circulating nurse.
Two training modalities were used: 1 (intensive classroom training) and 2 (hands on training). The willingness to use equipment, implement research, impact the hospital performance, and find new ways of using equipment were scale variables ranging from 0 to 100. Statistical analysis of qualitative data is made possible by assigning quantitative value to qualitative data using the Likert scale (Walker & Maddan, 2013). The frequency of technology use, patient satisfaction, and quality of service were measured using the Likert scale as follows:
- The frequency of technology use was ranked 1 (never), 2 (rarely), 3 (occasionally), 4 (frequently), and 5 (very frequently).
- The quality of services was ranked 1 (very poor), 2 (poor), 3 (average), 4 (good), and 5 (very good).
- Similarly, patient satisfaction was ranked 1 (very dissatisfied, 2 (dissatisfied), 3 (neutral), 4 (satisfied), and 5 (very satisfied).
The following table shows the sample data that was collected:
Based on the above data, the answers to the research questions are as follows:
What form of training is more effective in the training of staff members on the utilization of the equipment? Why?

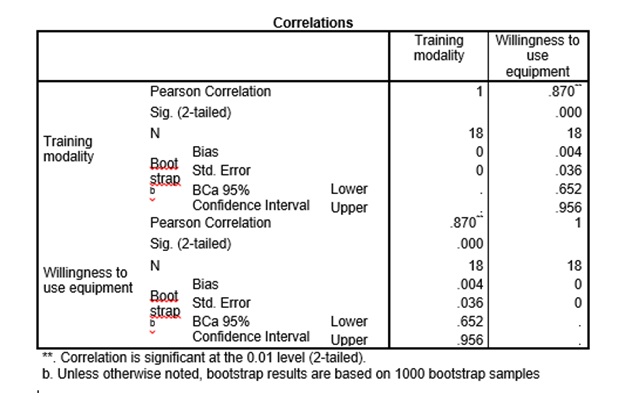
Pearson Correlation coefficient shows that there was a significant positive correlation between training modality and willingness to use equipment r = 0.87, BCa CI [0.652, 0.956], p ˂0.001. As the training modality shifted from 1 (intensive classroom training) to 2 (hands on training), the willingness to use equipment increased. This observation could be attributed to gaining confidence with equipment during training.
How does the intervention correlate with the frequency of the use of technology, patients’ satisfaction, as well as the quality of services provided?

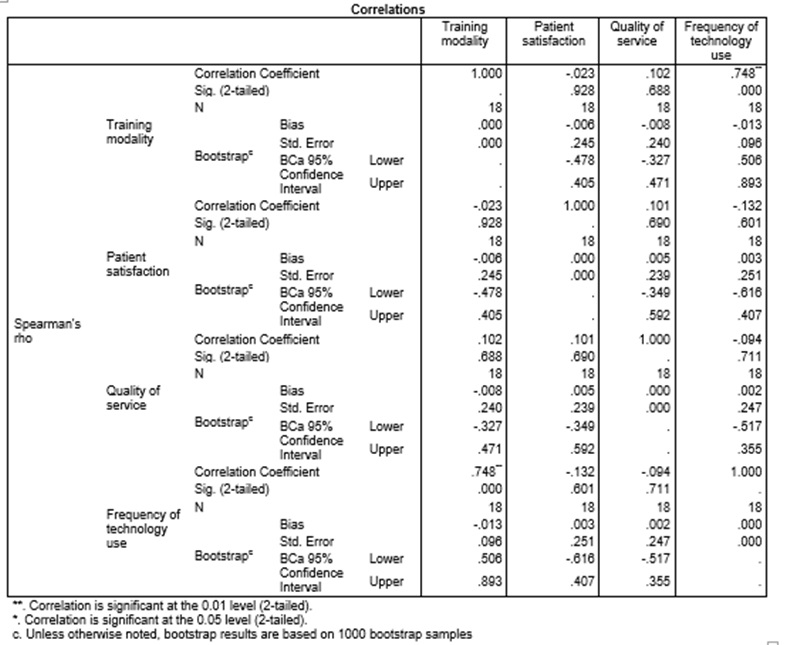
The Spearman’s correlation coefficient matrix shows that training modality does not have a significant correlation with patient satisfaction, rs= 0.-023, 95% BCa CI [-0.478, 0.405], p=0.928. The training modality is also not correlated with the quality of service rs= 0.102, 95% BCa CI [-0.327, 0.471], p=0.688. However, there is a significant correlation between training modality and the frequency of technology use, rs= 0.748, 95% BCa CI [0.096, 0.506], p˂0.001.
How does the intervention affect the participants’ willingness to implement their own research or find new ways of utilizing the equipment?

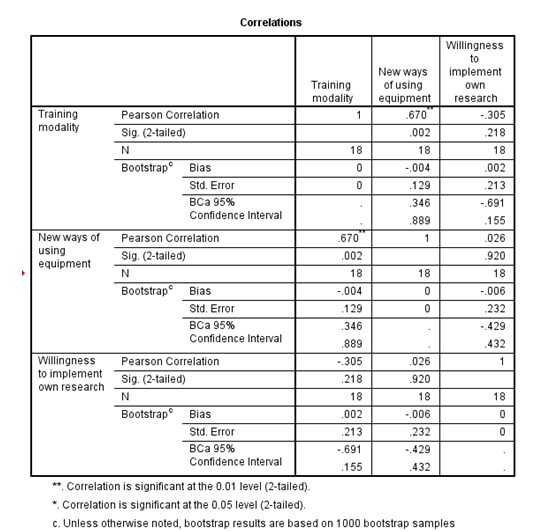
The point-biserial correlation coefficient shows that the intervention has a significant correlation on new ways of using equipment, rpb= 0.670, 95% BCa CI [0.346, 0.889], p˂0.001. However, there was no significant correlation between the intervention and the willingness to implement own research, rpb= -0.305, 95% BCa CI [-0.691, 0.155], p˂0.001.
How does the intervention affect the participants’ willingness to affect the hospital’s performance as well as certain purchasing policies?

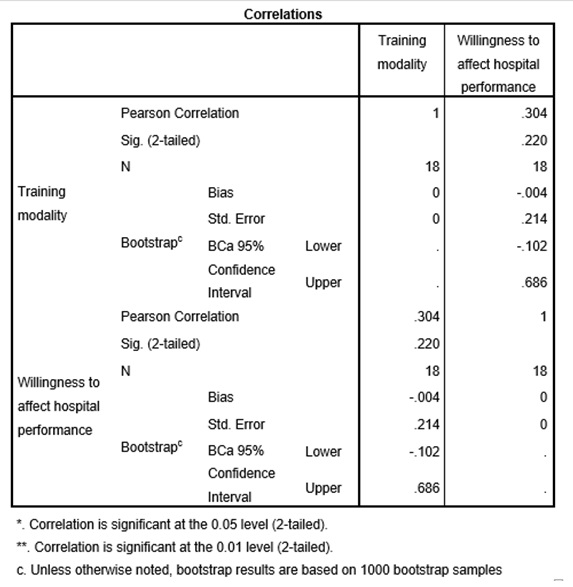
The results showed that there was no significant correlation between the intervention and the subjects’ willingness to affect the hospital’s performance as well as certain purchasing policies, rpb= -0.30, 95% BCa CI [-0.102, 0.686], p=0.220.
References
The results showed that there was no significant correlation between the intervention and the subjects’ willingness to affect the hospital’s performance as well as certain purchasing policies, rpb= -0.30, 95% BCa CI [-0.102, 0.686], p= 0.220.
Walker, J. J., & Maddan, S. (2013). Understanding statistics for the social sciences, criminal justice, and criminology. Burlington, MA: Jones & Bartlett Publishers.