Coca-Cola is an American multinational company and the world’s largest beverage manufacturer. More than five hundred brands of non-alcoholic beverages are directly attributable to Coca-Cola through direct ownership, licensing, and marketing (Coca-Cola, 2021). Some of the company’s main products include Coca-Cola Classic, Diet Coke, Fanta, Sprite, Minute Maid, and others. The company’s products get to consumers through a vast network of company-owned or controlled bottling and distributors, partners, wholesalers, and retailers.
The sale of Coca-Cocal’s non-alcoholic ready-to-drink beverages is affected by seasons with the last two quarters of a calendar year accounting for the highest percent of yearly sales. In addition, the beverages industry is highly competitive with competitors ranging from small companies to large multinationals. Pepsi Co. is Coca-Cola’s primary competitor in all the markets where Coca-Cola does business. Other significant competitors include Nestle, Keurig Dr. Pepper, The Kraft Heinz Company, Unilever, and several others (Coca-Cola, 2021).
Pepsi Co.
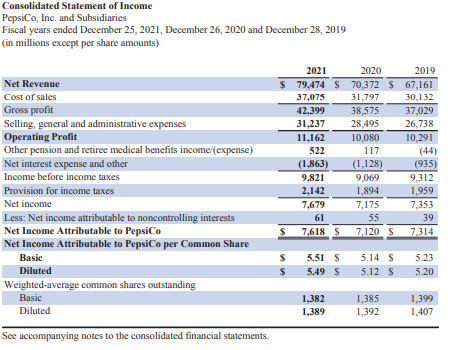
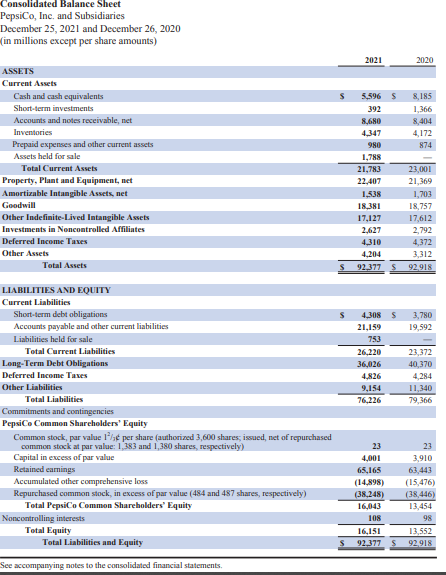
Pepsi is another multinational food and beverage company headquartered in the United States but with subsidiaries in multiple countries globally. Some of Pepsi’s main products include Pepsi Cola, Mountain Dew, Diet Pepsi, Tropicana, and many others. It was registered in 1919 in Delaware and since then it has built a portfolio of hundreds of food and beverages brands that are enjoyed in more than 200 countries (Pepsi, 2021). Pepsi’s products get to the customers through three major channels, direct store delivery, distributor network, and customer warehouse.
Pepsi’s business is also affected by seasonal variations whereby the sale of beverages is higher in warmer months while the sale of some dairy and food products is higher in cooler months. Beverage sales are generally higher in the third quarter primarily because of seasonal and holiday-related patterns. In addition, Pepsi faces intense competition from other food and beverage manufacturers with Coca-Cola being its primary competitor. Other significant competitors include Kellog Company, Nestle S.A, Monster Beverage Corporation, and several others (Pepsi, 2021).
Keurig Dr. Pepper
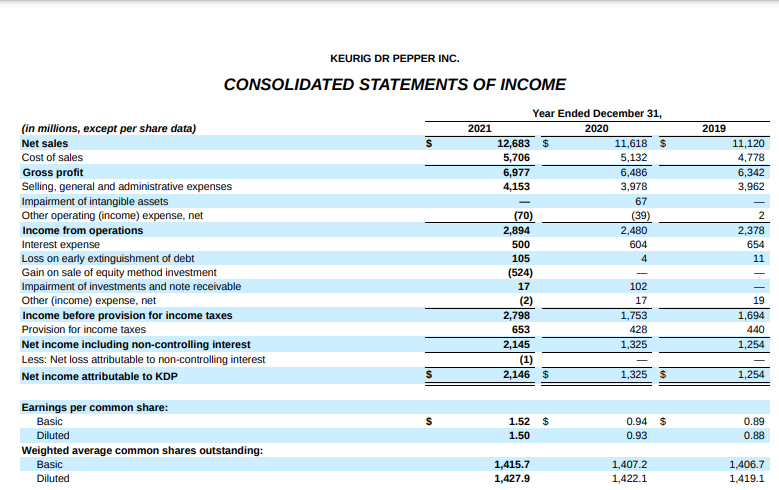
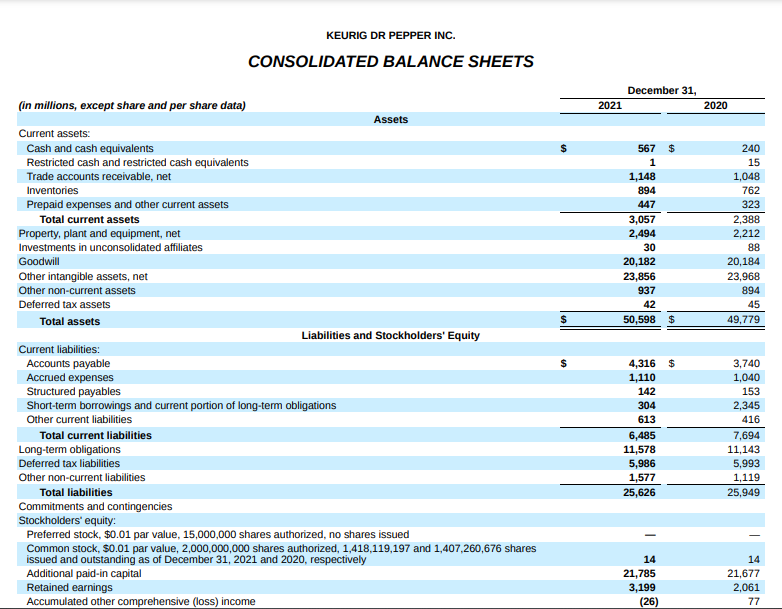
Keurig Dr. Pepper Inc is among the leading beverage manufacturers in the United States with its portfolio comprising carbonated soft drinks, non-carbonated soft drinks, and specialty coffee. The company’s main products include 7 Up, A&W Root Beer, A&W soda, and others. In 2018, Dr. Pepper Snapple Group, Inc. and Keurig Green Mountain, Inc. merged to form Keurig Dr. Pepper bringing together iconic companies that could challenge the dominant powers of Coca-Cola and Pepsi (Keurig Dr. Pepper, 2021). The consolidated company’s products are sold in the United States, Canada, Mexico, Europe, and Asia.
As a relatively smaller company compared with Pepsi and Coca-Cola, Keurig Dr. Pepper faces intense competition from these giants and other companies such as Reb Bull, Monster Energy, The Kraft Heinz Company, and The J.M. Smucker Company, among others. Beverage sales by the company are also affected by seasonality whereby cooler beverages’ sales are higher during warm seasons and vice versa.
Current Ratio
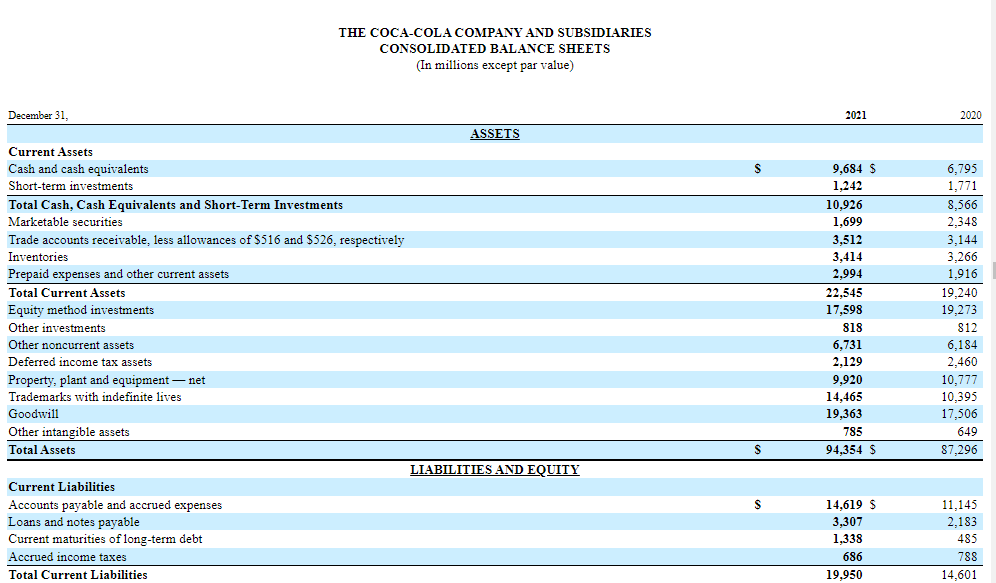
The current ratio is calculated by diving current assets with current liabilities (Mbona & Yusheng, 2019). Coca-Cola, Pepsi, and Keurig Dr. Pepper’s current ratios are 1.13, 0.83, and 0.47 respectively. The current ratio is an important liquidity indicator because it shows the number of times current assets can cover existing current liabilities. Ideally, current assets should double current liabilities. From the results of both current and quick ratios below, Coca-Cola is better positioned in terms of liquidity compared with Pepsi and Keurig Dr. Pepper. However, no company has the ideal current ratio of 2 indicating a need to boost liquidity by all three companies. With current liabilities above current assets, Pepsi and Keurig DR. Pepper may be forced to seek external financing if a serious need arises to clear the outstanding current liabilities. Further, only Coca-Cola has a net positive working capital (22,545 – 19,950) emphasizing the tight liquidity spot that Pepsi and Keurig Dr. Pepper are in. Finally, there are no other factors erroneously influencing the results of both ratios because the latest information from SEC 10K Form filings is used to calculate them.
Quick Ratio
The quick ratio is an improved current ratio calculated by dividing the difference between current assets and prepaid expenses by current liabilities (Mbona & Yusheng, 2019). The quick ratio for Coca-Cola, Pepsi, and Keurig Dr. Pepper are 0.98, 0.79, and 0.40 respectively. It is preferred by investors because it estimates liquidity conservatively. Additionally, the higher the ratio, the better for a company.
Gross Profit Percentage
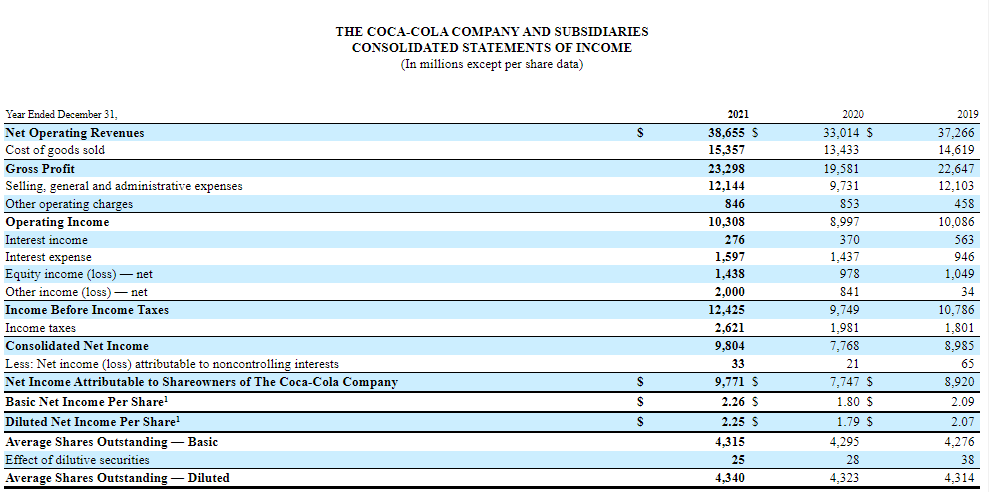
The gross profit percentage ratio is calculated by diving gross profit by total revenues. It measures how efficiently a company makes money by selling its goods and services (Mbona & Yusheng, 2019). The gross profit percentage for Coca-Cola, Pepsi, and Keurig Dr. Pepper is 60.27%, 53.35%, and 55.01 % respectively.
Inventory Turnover
Average inventory is calculated by diving net sales by the average inventory (Mbona & Yusheng, 2019). This ratio is important because it shows the number of times a business has sold inventory. The inventories turnover for Coca-Cola, Pepsi, and Keurig Dr. Pepper are 11.57, 18.66, and 15.31 respectively.
Asset Turnover
This ratio is calculated by diving net sales by average total assets. The ratio shows how efficiently a company is utilizing assets to generate revenues (Mbona & Yusheng, 2019). The asset turnover of the three companies is shown in the table below.
Accounts Receivable Turnover
It is calculated by diving net credit sales with the average accounts receivable (Mbona & Yusheng, 2019). The ratio shows the number of times a company collects its accounts receivables. Below is the inventory turnover for the three companies.
Comparison of Accounting Methods
Accounts Receivables
The allowance method anticipates that a certain percentage of goods sold on credit will not be paid while direct write-off advocates writing off debt only after a creditor fails to honor payment (Mbona & Yusheng, 2019). All three companies use the allowance method to account for unrecoverable debt. The allowance amount is determined by a company after assessing customers’ credit history, economic trends, market segmentation, and other information.
Depreciation
The straight-line depreciation method reduces the value of an asset with equal amounts over its useful life. In contrast, the double-declining balance method is an accelerated depreciation method as opposed to equal amounts in straight-line depreciation. The unit of production method on the other hand relies exclusively on physical output and assigns an equal amount of depreciation for every unit produced (Mbona & Yusheng, 2019). Keurig Dr. Pepper, Pepsi, and Coca-Cola use the straight-line depreciation method.
LIFO and FIFO
LIFO is an acronym meaning Last In First Out (LIFO) which means the stock that comes in last is sold first. FIFO (First In First Out) means the stock that comes in first is sold first (Mbona & Yusheng, 2019). Pepsi uses LIFO primarily and FIFO in very limited instances, Coca-Cola and Keurig Dr. Pepper use FIFO.
Intangible Assets
The various categories of intangible assets include copyrights and patents, leasehold interest, contractual agreements, customer relationships, and the company brand. For Coca-Cola, Pepsi, and Keurig Dr. Pepper, intangible assets are recorded at fair value and tested regularly for impairment.
Recommendation
I would recommend that one invests in Coca-Cola, Pepsi, and Keurig Dr. Pepper. This recommendation is informed by the analysis of the companies’ financial ratios. In particular, their liquidity is not severely strained with Coca-Cola’s current ratio being 1.13 which is enough to cover current liabilities. Further, Pepsi has an asset turnover of 0.86 indicating a particularly high level of efficiency. For a smaller company, Keurig Dr. Pepper has a particularly high gross profit percentage indicating an efficiency in product sales by the company. The other ratios also depict a positive trend as the companies show effective usage of assets to generate profits and a more than 50 percent gross profit percentage. Notably, none of the companies analyzed recorded a loss during the fiscal year. Some of the strengths apparent during this analysis are the existence of universally recognizable products and higher efficiency in selling products and earning profits from those sales. However, there is a risk of seasonality in sales and risks associated with hostile legislation that could limit the sale of some products.
References
Coca-Cola. (2021). Coca-Cola – Form 10 – K. Coca-Cola. Web.
Keurig Dr. Pepper. (2021). Keurig Dr. Pepper – Form 10 – K. Keurig Dr. Pepper. Web.
Mbona, R. M., & Yusheng, K. (2019). Financial statement analysis. Asian Journal of Accounting Research, 4(2), 233–245. Web.
Pepsi. (2021). Pepsi – Form 10 – K. Pepsico. Web.
Appendix: Pepsi, Coca-Cola, and Keurig Dr. Pepper
Pepsi Financial Statements
Coca-Cola Financial Statements
Keurig Dr. Pepper Financial Statements
