Introduction
- Community Health Center (CHC)- a healthcare provider in Central Florida.
- Its EHR system was not optimized.
- A gap analysis was carried out.
- Three major areas of improvement were identified.
- This presentation discuses elements of the initiative to optimize CHC’s EHR.
Community Health Centers (CHC) plays an important role in providing healthcare services to at-risk population patients, uninsured, and underserved populations in Central Florida. However, its EHR system had not been optimized for documentation and reporting hence the need for an initiative to improve service delivery and quality of care. A gap analysis review was carried out to highlight areas that needed improvement. Three major areas were identified and tagged for improvement including standardization of documentation process, aligning pre-visit planned care with the system, and optimizing the entire EHR system for better reporting. This presentation describes the vision of initiative that CHC undertook, discusses core clinical applications in the case study, and highlights some of the benefits identified by the awardee.
EHR Vision
- Provide improved patient care.
- Offer the best quality care services.
- Standardized documentation process.
- Improvement of pre-visit planned care.
- Align EHR reporting.
- Several objectives were set and achieved.
- Planned care would be enhanced.
- Patients with serious conditions would be identified.
- Gaps in care provision would be filled.
- Care providers would benefit.
- Medication errors would be reduced.
The vision of this EHR initiative was to provide improved patient care by offering the best quality care services to the available patient population. This vision would be achieved by creating a standardized documentation process within the existing EHR system to facilitate patient care management, coordination, engagement, and education. Additionally, the standardized system would make pre-visit planned care easy to report and align it with the EHR system. Finally, the EHR system would be optimized for general reporting and filling gaps that existed in the earlier version. The standardization and optimization of the EHR system would support this vision by allowing patients to access care during office and after work hours. Besides, patients would access their records from anywhere using the EHR platform. Patients would also get an electronic copy of their aftercare summary.
Besides, planned care would be enhanced through documentation during pre-visits. It would also be easy to identify patients with serious health conditions. The facility would be in a position to identify patients with gaps in their care programs and address different needs, such as sending reminders for follow-up meetings. The EHR optimization would also help care providers at the center to deliver quality and timely services. Providers would use e-prescribing, which is one of the proven effective ways of reducing medication errors (Mills, Weidmann, & Stewart, 2017). Additionally, physician order entry of labs and medication would be computerized, hence streamlining operations. Through the system, information on labs, referrals, and diagnosis would be tracked, flagged, and followed up for efficiency. Medication and other drug-related allergies would be highlighted to avoid medication errors, which might be costly for the center.
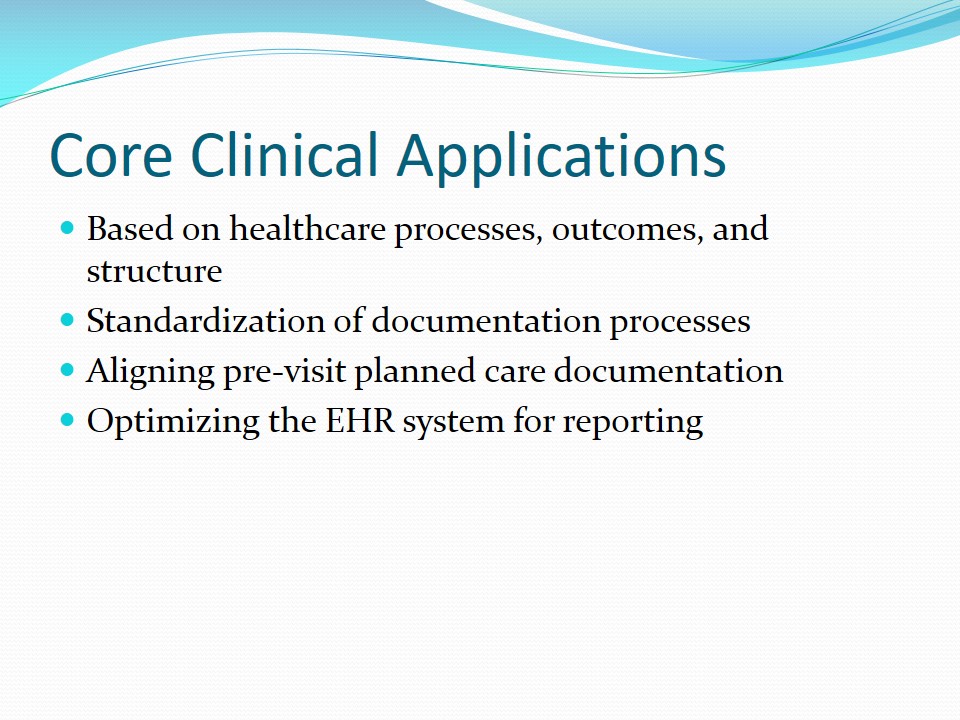
Core Clinical Applications
- Based on healthcare processes, outcomes, and structure.
- Standardization of documentation processes.
- Aligning pre-visit planned care documentation.
- Optimizing the EHR system for reporting.
The key core clinical applications in the case study touched on healthcare processes, outcomes, and structure. The specific applications included –
- Standardization of documentation processes within the EHR system to streamline patient education, engagement, care management, and care coordination.
- Aligning pre-visit planned care documentation with the existing EHR system.
- Optimizing the EHR system for reporting.
Core Clinical Application Discussion
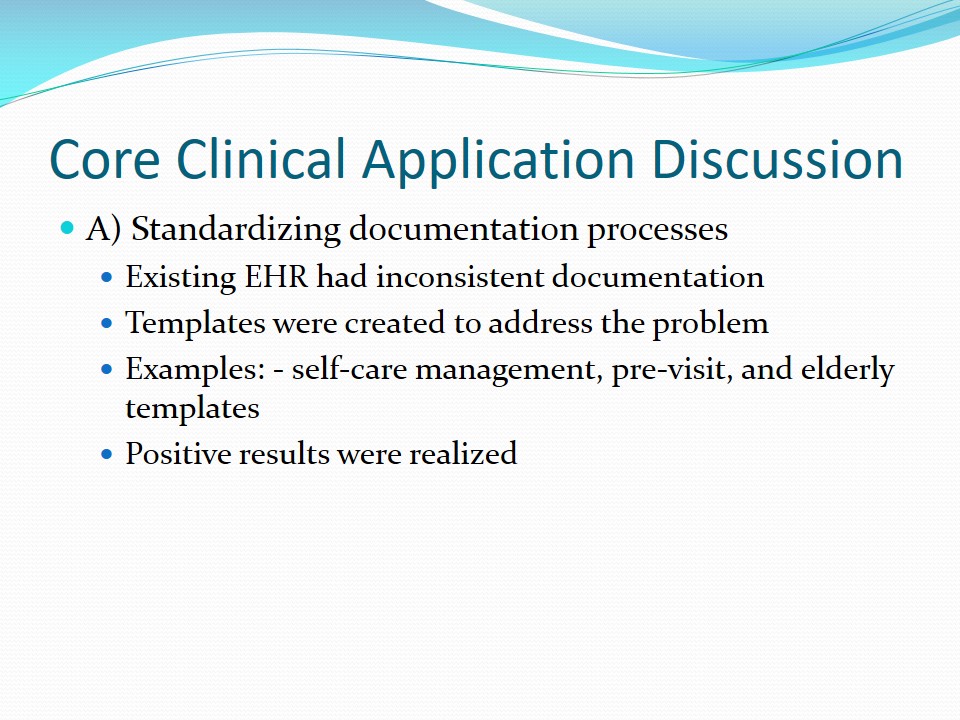
- Standardizing documentation processes:
- Existing EHR had inconsistent documentation;
- Templates were created to address the problem;
- Examples: – self-care management, pre-visit, and elderly templates;
- Positive results were realized;
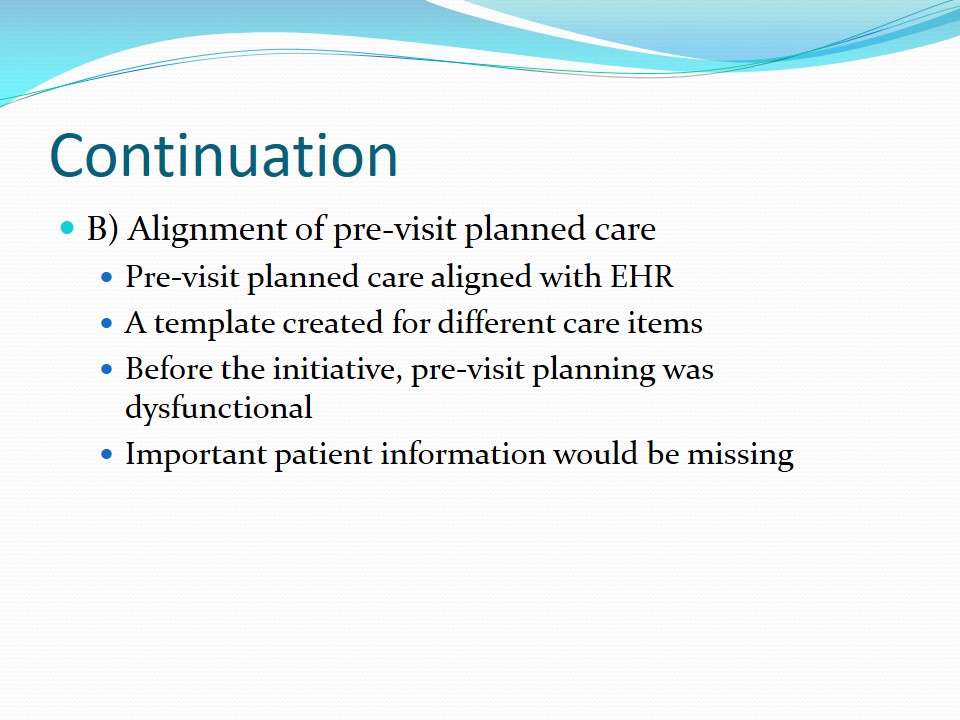
- Alignment of pre-visit planned care:
- Pre-visit planned care aligned with EHR;
- A template created for different care items;
- Before the initiative, pre-visit planning was dysfunctional;
- Important patient information would be missing;
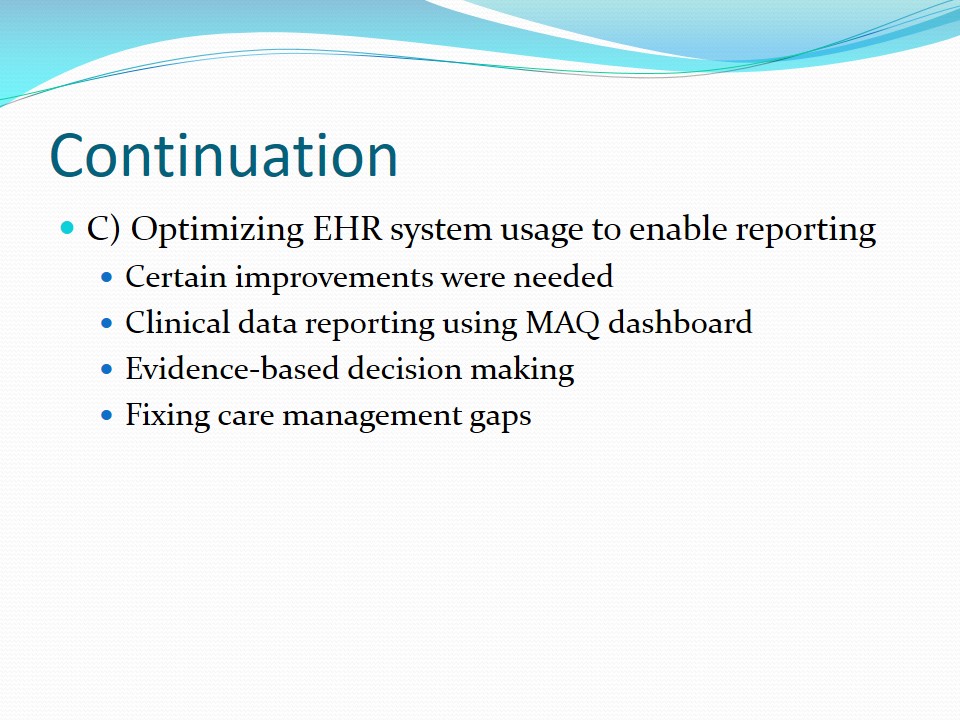
- Optimizing EHR system usage to enable reporting:
- Certain improvements were needed;
- Clinical data reporting using MAQ dashboard;
- Evidence-based decision making;
- Fixing care management gaps.
The existing EHR system had inconsistent documentation in patient care management, which led to inaccurate reporting and evaluation. Therefore, the project focused on fixing these problems by creating standard processes within the EHR. Different templates were created to guide documentation. The templates included pre-visit planning, elder care, and self-management. The self-management template was one of the major focus areas for this process. The concept and importance of self-care for patients is emphasized in Orem’s theory (Queirós, Vidinha, & Almeida Filho, 2014; Mohammadpour, Rahmati Sharghi, Khosravan, Alami, & Akhond, 2015). Patients have to be part of their care process by assuming a certain level of responsibility. As such, the initiative focused on improving patient engagement in the management of chronic diseases. The CHC integrated a self-management alert process to notify staff members about patients that needed self-care management goals among other functionalities, such as monitoring of adherence to medication, and education.
The second core clinical application was aligning pre-visit planned care with the existing EHR system. According to Grant et al. (2016), pre-visit planning helps staff members to plan, coordinate, and manage care delivery efficiently. In this case study, the focus was to create a template that would capture different EHR patient care items. Some of the items included laboratory reports, imaging diagnosis, referrals, immunization records, care gaps, action jellybeans, and telephone encounters among other aspects. Before the implementation of this project, staff members would at times fail to contact patients for the needed follow-up or preventive care. For instance, before the initiative, the average rate of contacting patients to plan for their care was at 49 percent. Besides, critical patient information was always missing, and thus care providers could not have timely reviews for quality service provision.
After evaluating the system, it was established that certain improvements needed to be done to allow effective reporting within the EHR system. For instance, there was a need to improve clinical data reporting using the MAQ dashboard. Additionally, CHC needed to start using evidence-based clinical decision-making support tools for diagnosis and other related care protocols. Finally, the center had to identify care management and provision gaps to ensure timely and quality service delivery to patients. Curtis et al. (2018) argue that ensuring proper reporting mechanisms within EHR systems plays an important role in streamlining service delivery to patients. For instance, having a functional reporting system promotes self-care among patients because they can access their care information remotely. Patients at risk of some conditions, such as heart attack could be monitored and assisted appropriately.
Benefits of the Initiative
- Increased pre-visit planned care documentation.
- Improved self-care management.
- Adherence to best practices.
- Cases of severe asthma reduced.
- Overall improvement in quality care provision.
One of the benefits identified by the awardee was the remarkable rise of patients with pre-visit planning documentation. After the implementation of the programs, the rate of such documentation increased to 95 percent. Besides, the rate of documentation for self-management goals among patients with chronic diseases improved tremendously. Currently, this rate stands at 56 percent. Additionally, the center experienced notable improvement by adhering to best practices, which led to the reduction of morbidity rates. For instance, after the implementation process, the number of patients with high blood pressure treated within the center has almost doubled to 62 percent from 39.97 percent. Similarly, due to the alert system integrated into the EHR, cases of severe asthma attacks dropped from 19 percent to 6.5 percent in two years.
Conclusion
- CHC made the right decision.
- Its EHR was not standardized or optimized.
- Pre-visit planned care was dysfunctional.
- Improvements after implementing the initiative.
- Positive patient outcomes were realized.
CHC made the right decision to evaluate its EHR system by identifying existing gaps with the aim of improving service delivery to patients. The center’s HER system was not optimized for efficient functioning. Standardization of documentation was lacking, and pre-visit planning was dysfunctional. However, after the implementation of the initiative to assess the system, certain key areas were marked for improvement. After the different programs were streamlined and aligned with the existing HER system, the center started noticing remarkable changes. Pre-visit planning improved remarkably with 95 percent of patients enjoying this service. Additionally, the rate of self-care management for patients suffering from chronic diseases increased significantly to 56 percent. Overall, service delivery improved, patients started receiving timely and quality care, and mortality and morbidity rates decreased. Therefore, positive patient outcomes were realized.
References
Curtis, J. R., Sathitratanacheewin, S., Starks, H., Lee, R. Y., Kross, E. K., Downey, L., … Engelberg, R. A. (2018). Using electronic health records for quality measurement and accountability in care of the seriously ill: Opportunities and challenges. Journal of Palliative Medicine, 21(2), 52-60.
Grant, R. W., Uratsu, C. S., Estacio, K. R., Altschuler, A., Kim, E., Fireman, … Heisler, M. (2016). Pre-Visit Prioritization for complex patients with diabetes: Randomized trial design and implementation within an integrated health care system. Contemporary Clinical Trials, 47, 196-201.
Mills, P. R., Weidmann, A. E., & Stewart, D. (2017). Hospital electronic prescribing system implementation impact on discharge information communication and prescribing errors: A before and after study. European Journal of Clinical Pharmacology, 73(10), 1279-1286.
Mohammadpour, A., Rahmati Sharghi, N., Khosravan, S., Alami, A., & Akhond, M. (2015). The effect of a supportive educational intervention developed based on the Orem’s self-care theory on the self-care ability of patients with myocardial infarction: A randomized controlled trial. Journal of Clinical Nursing, 24(11), 1686-1692.
Queirós, P., Vidinha, T., Almeida Filho, A. J. (2014). Self-care: Orem´s theoretical contribution to the Nursing discipline and profession. Journal of Nursing Reference, 4(3), 157-163.