Abstract
In this study, Sydney’s green suburbs, and Mascot to be precise was studied. Anthropologic activities, allocation of green areas, and configuration of the suburb were examined. Data was collected through observation during a two-hour field trip as well as conducting searches on the internet.
It was noted that 0.64Km2 of Mascot’s region were green spaces. While sporting fields were well allocated, little or no space was allocated for national parks/reserves. There was observed diversity in animal and plant life.
The deteriorating state of Mascot’s green spaces call for the management to embark on preservation and regeneration. This will improve visitors’ experience. This study was limited by the fact that it was done on small scale and over a short time. There is need for local authorities to come up with policies which will lead to enhancement of biodiversity in green spaces.
Introduction
Anthropologic activities are currently a threat to the human race. Green spaces are particularly under threat from the rise in industrialization and the consequent rise of suburban areas. In Australia, green areas are particularly encroached thus negatively impacting on human beings and the ecosystems around the areas.
It is for these reasons that a lasting solution should be established to deal with the problems resulting from these activities. To curb pollution and environmental degradation, there is need to have participation of all stakeholders.
By laying special emphasis on the L’estrange Park as part of the Mascot’s green spaces, this paper seeks to evaluate this area critically by examining the anthropological activities, biodiversity, plants and animal life and general composition of this green space. These are compared to conditions found in other suburbs.
Materials and Methods
To collect required data to complete this research, an internet search in conjunction with a field trip were conducted. The coverage of Mascot’s green area was determined using Google Map data. It was thus possible to come with the exact area that forms green areas of Mascot.
The two-hour visit to the L’estrange Park on a Saturday morning was necessarily for enhancing understanding of the Mascot suburb. The recorded human activities among other variables such as the park’s condition were necessary for enhancing comparisons with other suburbs as well as forming a basis for recommendations on ways of improving the park.
Results

Table 1: Average Class Data.
Table 1 indicates that 17.79 percent of Sydney is composed of green spaces. The estimated area composed of park/reserves i.e. 9.29 percent while 4.41 percent of the green areas are made of sporting fields.
Table 2: Mascot Data.
The mean class data for the entire Mascot area is almost similar i.e., 17.79 percent is for suburbs while 18.13 percent for Mascot. While park/reserve occupancy is 9.29 percent for other suburbs, Mascot’s is slighter lower at 7.08 percent.
The Mascot area does not have national parks, nature reserves or even sanctuaries. Sporting fields make 5.38 percent of Mascot’s area while in other suburbs sporting fields are smaller with a percentage of 4.41 in coverage.
From Chart 2, it is clear that the largest area in Mascot’s green spaces is occupied by parks/reserves. The portion taken by sporting fields and other areas is also a significant one.
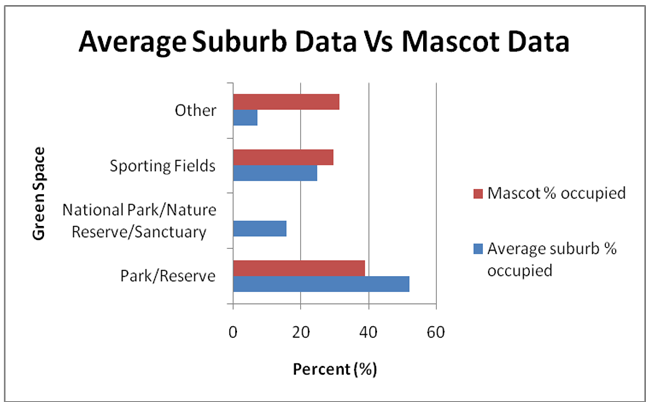
As illustrated in Chart 3, parks/reserves occupy a very small portion of Mascot’s green space while national park/reserves are not present at all. The fact that the sporting fields as well as other areas cover a significant portion is an indicator that there is disorganization in allocation of Mascot’s green areas when compared to other suburbs.

Table 3: Findings of Field Trip.
Several findings were drawn from the field data presented in Table 3. Numerous varieties of animal and plant life were observed; there was presence of birds and insects and trees such as figs and coral trees. The trees were mainly located around the park’s perimeter. Other floral composition includes shrubs and bushes, as well as grass which is mainly to be found in sporting and recreational areas.
Given the well assorted roads and elaborate neighbourhood around the park, there is no doubt that the park is easily accessible to the public. It is evident that numerous games are played in the park as illustrated by a pitch which is located at the centre. This pitch can also be used for soccer and rugby among other sporting activities (Botany Bay City para 2). The park was however unoccupied in the morning of the visit.
Some of the other human activities to be seen in the park include dog walking and cycling. Other available amenities include public toilets, seating areas, and children’s playground. Overuse of the walking trail calls for the parks maintenance. The picnicking areas require tidying up. Overall, it is clear that L’estrange Park has emphasized on recreation, sporting and relaxation activities, and the animal and plant life is vibrant.
Discussion
Comparing Mascot’s green spaces with green spaces of other suburban places, it is evident that there is almost similar allocation, with Mascot’s green spaces constituting 18.03 percent while other suburbs have 17.79 percent. While Mascot is hardly occupied by national parks/sanctuaries, Mascot does not contain any of these; an indicator that Mascot ought to invest in national parks/reserves.
To do this, the Park’s management can widen the current parks, merge isolated green spaces or convert some of the industrial or residential spaces into parks (Felson and Pickett 550). The diversity of the park’s ecosystem is well checked given the diversity in plant and animal life; this indicates that good management and sustainable measures are in place (Chapin et al. 241). Green coverage in Mascot is evidently showing mixed results.
Mascot plans to preserve and rejuvenate the peripheral areas as indicated by Botany Bay City (para 5). To achieve this, trees and grasses will be planted, merging green spaces that are adjacent. By safeguarding native spaces and avoiding isolated green spaces, it is believed that preservation measures will be more effective (G-Online para 4).
This is what Mascot’s management should embark on; otherwise the Park’s biodiversity will dwindle and affect its dependants negatively. The Park’s management should also embark on bettering the picnic and walking spaces by perhaps using raised wooden platforms to avoid wearing out of grass areas (Maas et al. 580). To enhance the picnickers’ experience, the management should install a new coin-operated barbeque.
This study was limited in that the observation period of two hours was too short to make grounded observations. Data was recorded by one person only at one point location. In future researches, data collection should involve more people located in different places and at different times.
This would reduce bias and enhance comparison. All in all, this study was helpful in giving an overview of Mascot’s green area, the people, and animal and plant life in this area.
Conclusion
Availability of green areas in Mascot is almost the same as that of other suburbs, with greater variation in sporting fields in favour of Mascot. Fauna and flora is in a wide variety in the park. This biodiversity however ought to be preserved and regenerated; and this should be a priority to the Park’s management. Mascot’s green spaces need better preservation measures given the threat of human activities they are in.
Walking trails and picnic area should particularly be improved while a new coin-operated barbeque should be put in place to boost picnickers’ experience. This study was conducted at small scale hence the observations were not very valid. Green areas should be protected from pollution by putting policies in place.
Future research should, however, be conducted exploring more areas at different time periods. Eventually, green spaces and biodiversity will be realized in Mascot and Sydney in general.
Works Cited
Botany Bay City. Botany Bay Parks. 2011. Web.
Chapin, Stuart, Carpenter Stephen, Kofina Gary, Folke Carl, Abel Nick, Clark William, Olsson Per, Stafford Smith Mark, Walker Brian, Young Oran, Berkes Fikret, Biggs Reinette, Grove Morgan, Naylor Rosamond, Pinkerton Evelyn, Steffen Will and Swanson, Frederick. “Ecosystem stewardship: sustainability strategies for a rapidly changing planet.” Trends in Ecology and Evolution 25. 4; (2009): 241-249.
Felson, Alexander and Pickett Steward. “Designed experiments: new approaches to studying urban ecosystems”. Frontiers in Ecology and Environment 3.10; (2005): 549-556.
G-Online. Green spaces’ promote health. G-Magazine, 2009. Web.
Google Maps. Mascot. 2010a. Web.
Google Maps. Lestrange Park. 2010b. Web.
Maas, Joland, Verheij Robert, Groenewegen Peter, and Spreeuwenberg Pet. “Green space, urbanity, and health: how strong is the relation?” Journal of Epidemiological Community Health 60.7; (2006): 587–592.