Introduction
Consumer behaviour is the general function of a customer’s preference and taste as well as the resultant utility. Consumers have variant perceptions of the satisfaction they expect to derive from a certain good or service which comprises their taste. On the other hand, a consumer has a certain degree of bias towards a given product given a choice between two which comprises their presence.
These two aspects influence the level of utility the consumer derives from utilization and consumption of the product in question (Frank and Bernanke 2001, p12).
However, a consumer’s preference and taste is constrained by variety of factors such as operating income, government restriction as to the allowed purchase quantity as well as the type of products. In effect, a consumer will spend their money on a bundle of goods that offer the maximum amount of satisfaction. Their choice of such bundles is therefore influenced by their tastes and preferences.
1. According to the neoclassical utility model as proposed by Mahoney (2001) in the case of two income goods x and z the consumer given a choice between the two products that are not substitutes the consumer has a certain preference for good x over good z presenting three options as follows :
- x as preferred to z
- z as preferred to x
- z and x equally preferred or indifferent
These options can be represented as follows
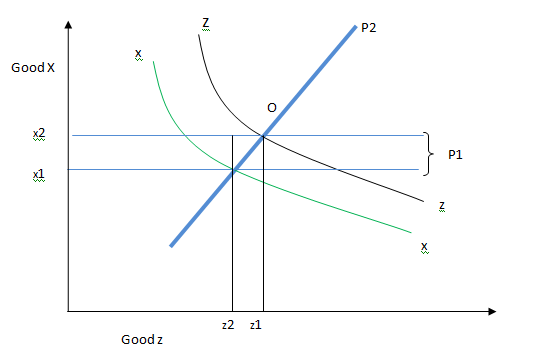
Curve x represents a consumers preference for good x over z. Curve z represents a consumers preference for good z over x. P1 represents policy 1 which presents the consumer with a voucher that can be exchanged for a fixed amount of good x.
Line P2 represents a policy that presents the consumer with an income supplement sufficient to buy the same amount of good x assuming that every supermarket has the same price for good x (Witt 2001a, p. 1-5).
At point O Under these two policies households’ preferences over the two goods will always have exactly the same impacts on the household in terms of its utility level and consumption levels of the two goods as illustrated by the diagram above.
At point O a consumer who has a higher preference for good x over good z under policy 1 as illustrated by curve (x,x) would ordinarily consume a bundle of quantity (x1,z1) having exchanged the voucher offered by the first policy however they can now consume for (x2) amount of good x after trading in the voucher for a fixed amount of good x which is the difference between (x1) and (x2).
A household which on the other hand has a higher preference for good (z) as opposed to (x) will consume (x2) amount of good (x) which is the equivalent of the (z2) amount of good z that they ordinarily are willing to consume as offered by the second policy.
In effect as long as the voucher offered by policy one is equal in quantity terms to the difference between the two curves representing the household differences in preferences the two policies will give similar results (Witt 2001b, p. 23-36).
2. Under certain house hold preferences the two households will have potentially different impacts on the households in terms of its utility and level of consumption. These circumstances are as follows.
- If the goods are perfect substitutes
The preference curve for perfect substitutes is as follows
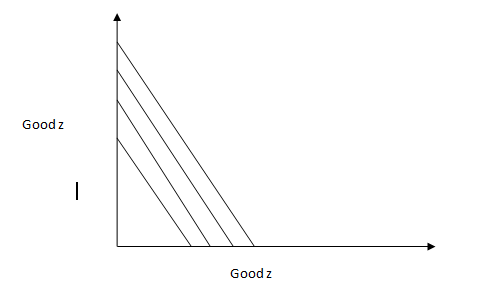
The households will willingly exchange one good for the other despite their preference therefore there will be a rather rigid manner in which they utilize the commodity in regards to quantity and utility. Therefore an implementation of either of the policies will always result to different results.
- If the goods are perfect complements
Aconsumer may have their own preference for either good however perfect complements vary and restrict such preferences to ensure that each quantity of one good acquired is acquired with an equal or similar quantity for proper enjoyment of either of the goods. Therefore, implementation of one both or either of the policies will lead to entirely different results. The utility preference and consumption curve will be as follows :
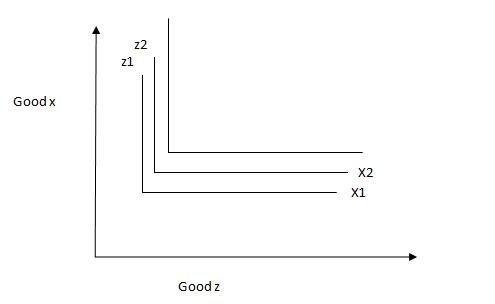
If the household acquires a unit of good x the household it ensures that it derives as much utility from it as one unit of good z and does the same for two units of good x this ensures a consistent difference in the overall utilisation and use of the goods. In effect implementation of either policy will always lead to different modes of consumption therefore different levels of utility (Nevo 2003).
- In case the products are imperfect substitutes
If a consumer perceives a product to be an imperfect substitute of the other they have different levels of preference and utility for either product. It would not be possible therefore to equate the two goods in regards to consumption and preference. Therefore each product will have a different indifference curve. Application of either policy will lead to different results arising from the lack of similarity.
3. The two policies cannot be substituted because the first policy does not vary with the earnings and preference of the household but rather offers a rigid biased offer for a fixed quantity of good x while the second policy is a flexible policy that varies with the needs and capacities of households.
The approach taken by policy one limits the consumer’s choice in the amount of good x they consume. The consumer will always take advantage of a subsidy and they will therefore have little choice in the minimum amount of good x they will acquire.
The second policy on the other hand increases the maximum amount of good x the consumer is willing and able to consume. It increases the upper limit buy matching the subsidy with the consumers actual spending. This therefore maintains their choice but influences their capacity.
4. Utility as a function of preferences defines how much pleasure the consumer derives from a certain good or product. The rate at which a household consumes a certain good depends to a great extent on the satisfaction they anticipate from the good. This further has a bearing on the amount of a given product they are willing to consume.
On the other hand the consumers wilingliness to consume a product will however be curtailed their cost budget therefore limiting the amount they actually purchase of a given product (Bianchi 2002).
Therefore, the amount of a certain product that a household consumes is a function of their budget constrains as well as their tastes and preference or rather the utility they receive from the good. The utility function represents the relationship between utility measures and the possible combination of goods as shown by the diagram below.
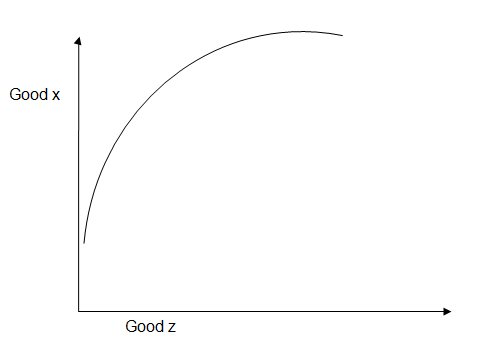
As such the utility derived from a given bundle of goods by a household increases at a decreasing rate. Therefore the more of a certain commodity the household consumes the lesser utility they derive from it. The two policies aim at increasing the amount of a certain good that the consumer purchases.
They will however not always achieve utility since the more the household consumes the lesser utility they derive. The total utility derived from consumption of the specific bundle of goods reduces as the consumer gets used to large amounts of the goods therefore reducing the satisfaction.
There are however alternative ways of increasing the utility as well as the consumption of these goods. This can be achieved through a product subsidy to reduce the price of the commodity. According to Nicholson (2002) a characteristic of preference is that more is always good.
A household is ready to settle for more of the cheaper product as opposed to lesser of another product for the same amount of money. A reduction in the price of product x changes the slope of the budget constraint holding the income constant as represented by the diagrams below
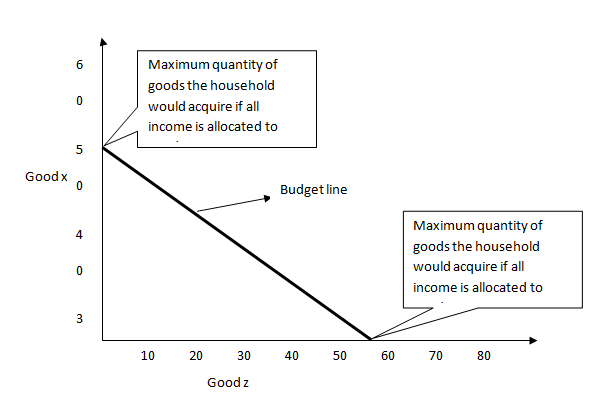
If the price of good x is 10 dollars, a unit the consumer who has a constrained budget of 400 dollars can only buy 40 units of good x. The household looks for the bundle that gives the best utility within the budget line. The consumers’ willingness to consume is limited by their anticipation of spending and their limits in budget. This however can be changed by the reduction in the prices of the product.
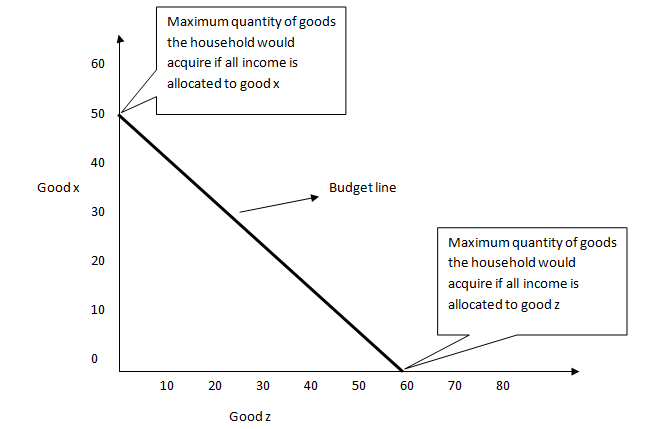
With a product subsidy that reduces the price, the budget line slope changes to adjust to the new price. If for instance the price for good x reduces to 8 dollars a unit the budget line changes and the consumer thanks to the price subsidy of 2 dollars per unit can acquire more units of good x he can now consume up to 50 units of the good with the same budget constraints as follows.
A consumer will be more willing to purchase additional units of good x at the same level of preference due to the reduction in price. This also has an implication on the utility derived from the consumption of the goods.
- The firm will minimise its costs by reducing its labour usage where the average product of labour is increasing. Since the marginal product is greater than the average product of labour in the short run the firm will minimise its costs when the marginal cost of labour and capital are equal to the average product.
- In the long run however the marginal product diminishes and the input combination that supports the least cost is where the marginal product for labour and capital is zero or where the average product of labour and capital are greater than the marginal product of labour and capital (Perloff 2012).
- The firm will reap benefits in the long run since the marginal cost of production which is the additional cost of producing an extra unit of a given product is lower than the average product hence attracting the economies of scale (Perloff 2012). The firm will incur lesser cost per unit in manufacturing additional units of the good due to the benefits of scale.
References
Bianchi, M 2002, Novelty, Preferences, and Fashion: When Goods Are Unsettling’, Journal of Economic Behavior and Organization, Vol 47 no 1, pp. 1-18.
Frank, R., and Bernanke, B 2001, Principles of Economics. McGraw-Hill Irwin, Boston
Mahoney, D 2001, On the Representation Theorems of Neoclassical Utility Theory: A Comment, Web.
Nevo, A 2003, ‘New Products, Quality Changes, and Welfare Measures Computed from Estimated Demand Systems’, Review of Economics and Statistics, Vol 85 no 2, pp. 266-75
Nicholson, W 2002, Microeconomic Theory: Basic Principles and Extensions, South Western College Publishing, Ohio
Perloff, J 2012, Microeconomics global economics global edition (6th edn), Pearson education, New York
Witt, U 2001a, ‘Economic Growth- What Happens on the Demand Side?’ Journal of Evolutionary Economics, vol 2 no. 2, pp. 11: 1-5.
Witt, U 2001b, ‘Learning to Consume—A Theory of Wants and the Growth of Demand’, Journal of Evolutionary Economics, Vol 11 no. 1, pp. 23-36.