Step 1
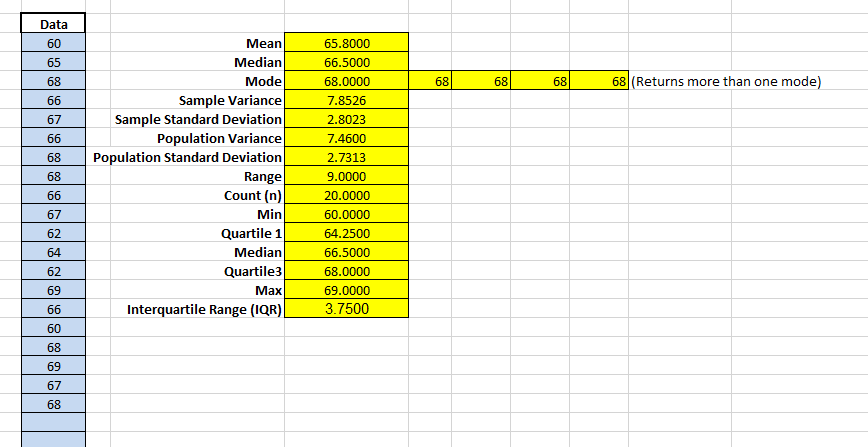
The 10 provided values were 60, 65, 68, 66, 67, 66, 68, 68, 66, and 67. The additional ten values used were 62, 64, 62, 69, 66, 60, 68, 69, 67, and 68. From the data analysis, the statistical mean and the sample standard deviation were found to be 65.8000 and 2.8023, respectively. When compared to the mean obtained from averaging the twenty sample values, my height of 64 inches is shorter.

Step 2
Due to the prevailing coronavirus disease 2019 (Covid-19), the study employed the convenience sampling technique. The method was preferred because it only requires the respondent’s consent to participate in the survey and does not need the generation of simple random samples (Jager et al., 2017). Following the movement restrictions and interactions amongst people as part of the government’s containment measures, the targeted participants comprised of few people doing their shopping in nearby grocery kiosks.
The participants constituted of adults with ages ranging from twenty-one to twenty-eight years. Additionally, the study involved four Native Americans, three Hispanic Americans, two Asian Americans, and one African American. The ten respondents encompassed six males and four females, and seven of them were college students. Prior to the commencement of the data-taking and recording, every participant ensured that the required personal protective equipment was appropriately deployed to deter the likelihood of contracting Covid-19.
Step 3
Using the Empirical Rule (68-95-99.7), the established lower and upper values for the twenty heights were found to be 62.9977, 60.1954, 57.3931, and 68.6, 71.4, 74.21, respectively. The values were instrumental as they demonstrated the spread of the 20 heights and also exhibited that the study values assumed a normal distribution curve.

From the study, the probability of participants being shorter than 64 inches (my height) was 0.2603 while being taller was 0.7397. This implied that 73.97% of the population were taller than me while my height was larger than that of 26.03% of the inherent population.

Reference
Jager, J., Putnick, D., & Bornstein, M. (2017). II. More than just convenient: The scientific merits of homogeneous convenience samples.Monographs of the Society for Research in Child Development, 82(2), 13-30. Web.