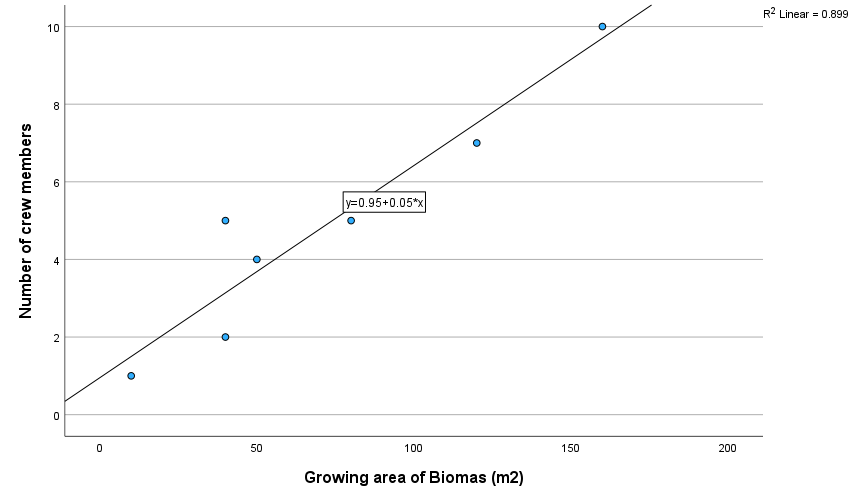
The scatterplot for the sample of oxygen shows an uphill diagonal spread of data from left to right between the number of crew members and the growing area of biomass (m2), which indicates that the two variables are is linearly related. The equation for this data is represented as: Number of crew members = 0.95 + 0.05 (Growing area of Biomass (m2) (Rumsey, 2021). Further, the correlation coefficient for the oxygen data r = 0.948**. With the significant level set at α = 0.05, it reveals a strong positive association which is statistically significant at (r =.948, n = 7, p =.001) (Schober et al., 2018). Therefore, the null hypothesis that there is no relationship between the number of crew member and growing area of biomass (m2) is rejected for the alternative.
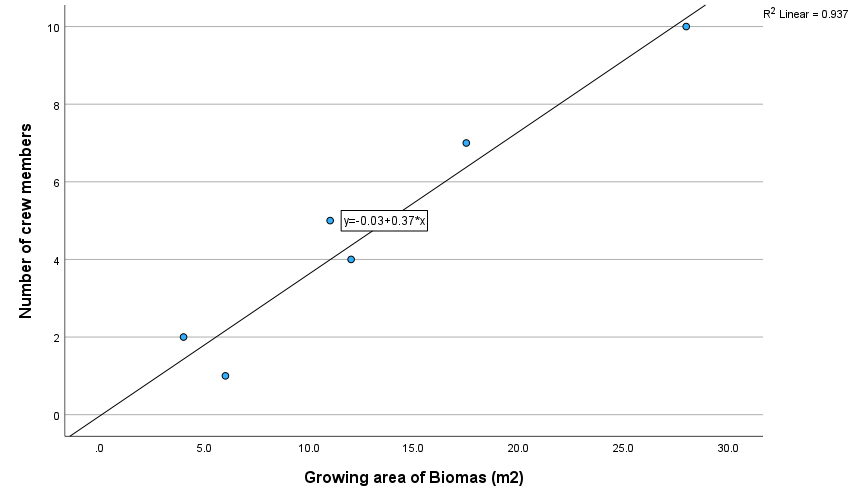
The scatterplot for the sample of water shows a diagonal spread of data from left to right between the number of crew members and the growing area of biomass (m2this demonstrate that the two variables are is linearly related. The equation for this data is represented as: Number of crew members = 0.03 + 0.37 (Growing area of Biomass (m2) (Rumsey, 2021). Further, the correlation coefficient for the water data r = 0.968**. With the significant level set at α = 0.05, it reveals a strong positive association which is statistically significant at (r =.968, n = 7, p =.001) (Schober et al., 2018). Therefore, the null hypothesis that there is no relationship between the number of crew member and growing area of biomass (m2) is rejected for the alternative.

References
Rumsey, D. J. (2021). How to interpret a scatterplot. Dummies. Web.
Schober, P., Boer, C., and Schwarte, L. A. (2018). Correlation coefficients: Appropriate use and interpretation. Anesthesia & Analgesia, 126 (5), 1763-1768. Web.