Abstract
One of the most commonly used statistical method for determining and measuring the relationship between two or more variables is the correlation. Based on the random integers that have been collected for performing three fictitious studies in this report the correlation has been calculated between variables.
The findings from correlation are then analyzed using methods including histogram, mean, standard deviation, and range to draw conclusions regarding the distributions of correlation coefficients (scores) obtained for each of the study, The conclusions from the study suggest that the mean correlation is close to 0 using random data.
The statistical dispersion measured by standard deviation and range is higher for study#1 and lowest for study#2 which suggests that the sample size does have implications for analysis. The report also provides a descriptive discussion on the correlation method, its history, levels of variability, and psychology studies that may involve prediction of random variables.
Introduction
In this report, the findings of correlation and measures of statistical dispersion in the data derived from selection of random integers are presented. The report initiates with detailing the concept of correlation method and ways of interpreting the correlation. It then describes the level of variability and introduces studies which may involve prediction of random variables. The experiment that has been performed through selection of random integers is then described and results are presented along with a meaningful discussion.
Correlation is a statistical method which can be used to determine the dependence between two or more variables. By dependence it is implied the relationship between two or more variables in which the value of one variable depends upon the values of another variable. The use of correlation in psychological studies is very common which are aimed at predicting and analyzing the relationship of human behavior and factors which have influence on it.
The correlation studies result in the determination of the correlation coefficient which is a measure of the strength of the relationship between variables.
The correlation coefficient values range between -1.00 to +1.00 which suggest that if the value of correlation coefficient is close to -1.00 then there is a negative correlation (relationship) between the selected variables and if the value of correlation coefficient is close to +1.00 then there is a positive correlation (relationship) between the selected variables.
For a neutral correlation between variables the value of correlation coefficient has to be very close to 0. Therefore, in this way the correlation in psychology helps in understanding the association of variables under investigation.
The history of correlation method can be traced back to the study during 1850-52 conducted by Sir Francis Galton, a statistician who was interested in heredity trends of intelligence found in humans and aimed at finding out the correlation between the intelligence levels of individuals with their predecessors.
The spread or variability in the variable is referred to as statistical dispersion. The measure of the statistical dispersion starts from 0 which occurs when all the data collected is the same and it rises as the variability in the variable increases. Therefore, it could be stated that statistical dispersion measure close to 0 indicates low level of variability and as it goes higher and above 1 then it suggest high level of variability in the variable.
There are different measures which can be used for determining levels of variability which may include variance, variance to mean ratio, standard deviation, interquartile range, range, mean difference, median or average absolute deviation and distance standard deviation.
Studies that may involve the prediction of random variables could include behavioral studies that are conducted in a naturalistic environment and also those which involve investigation of animal behavior.
Methods
The experiment that has been performed for the present study involved selection of random integers for two fictitious variables x and y. This was achieved by selecting different options for data selection on the website – random.org. The process was simple which used three different approaches for gathering data.
Firstly, 10 integers were randomly derived through the online integer generating system, which were considered as the values of five subjects. Then, the correlation was calculated between x and y, and the value of correlation coefficient was recorded. This step was performed 30 times and 30 different values of correlation were recorded. Secondly, the sample size was increased to 60 randomly selected variables, which were considered as the values of 15 subjects.
Similarly, the correlation was performed between variables x and y, and the value of correlation coefficient was recorded. This step was also performed 30 times to record 30 different values of correlation. Lastly, the sample size was further increased to 200 randomly selected variables, which were considered as the values of 100 subjects and the correlation was performed 30 times to record 30 different values of correlation. For gathering of data and performing different statistical methods both MS Excel and SPSS have been used.
Results
Histogram for Three Studies
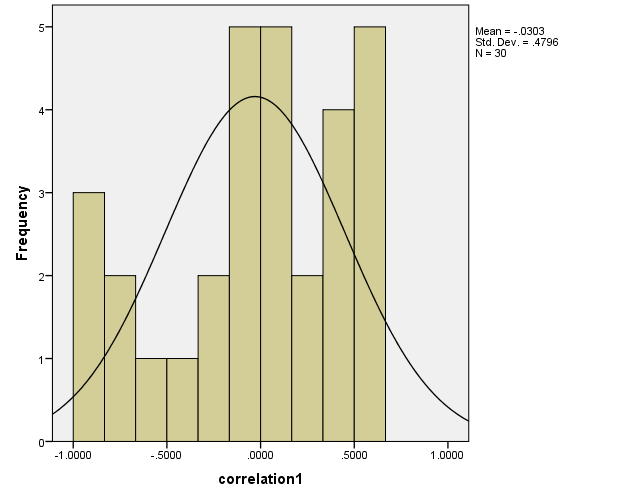
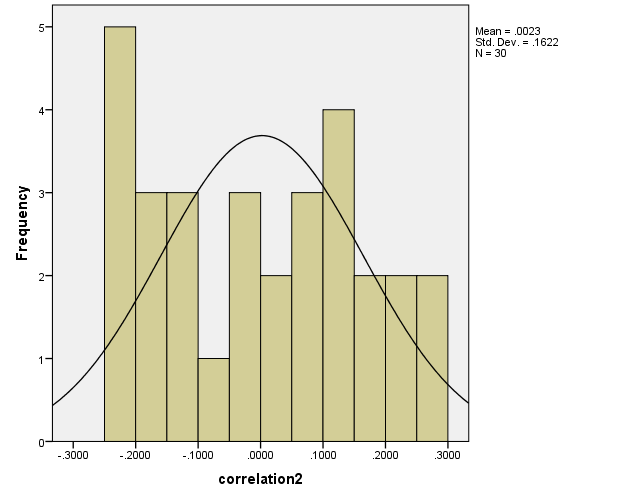
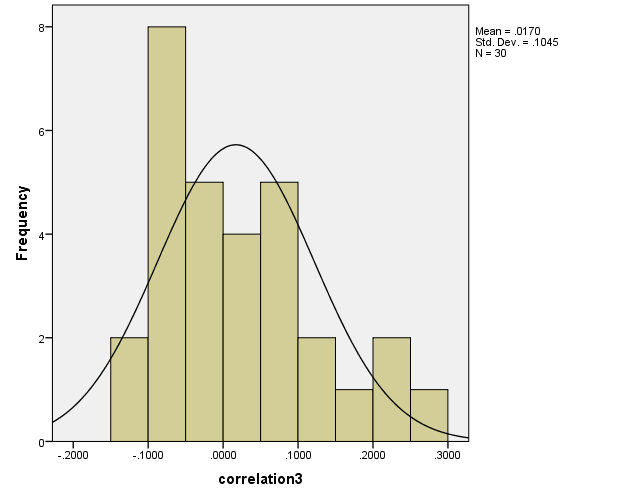
Using SPSS, histograms for three studies involving data sets derived on the described methodology are given in the following.


Degree of Freedom
For each study the number of data entries n is equal to 30 therefore the degree of freedom is obtained as DF=n-1 i.e. DF = 30-1 = 29
Critical Values
Using SPSS, one-tail and critical two-tail t values have been obtained using one sample t test for each study and the results are as follows:
- Study #1: -.346 and.732
- Study #2:.078 and.938
- Study #3:.892 and.380
Range of Variation
Using SPS, the range of variation has been obtained by using Analyze>Descriptive Statistics>Descriptives>Range
Standard Deviation
In SPSS the standard deviation for each study is obtained using one sample t test and the results are provided in the following:
- σ1: 0.4796
- σ2: 0.1622
- σ3:.0.1045
Correlation Mean
In SPSS the mean correlation for each study is obtained using one sample t test and the results are provided in the following:
- µ1: -0.0303
- µ2: 0.0023
- µ3: 0.0170
Conclusions
Based on the analysis presented above it could be suggested that the distribution of correlation scores using randomly data for study#1 is more dispersed than scores for study#2 and study#3. The statistical dispersion measured by standard deviation and range is higher for scores in study#1 as compared to study#2 and study#3. The mean correlation of each study is close 0 as it is expected for random data.
This is also reflected by the normal distribution curve in the histogram. However, for study#1 it is slight less than 0 as the distribution is scewed leftwise.
Reference List
Brutlag, J. D. (2007). The development correlation and association in statistics. Web.
Gravetter, F. J., & Wallnau, L. B. (2008). Statistics for the behavioral sciences. New York: Cengage Learning.
Haahr, M. (2012). Random integer generator. Web.