Introduction
The accessories chosen to be analyzed are sports shoes which are available in supermarkets and market stalls across the country. The price for these products varies from one company to another but the products that has been chosen for this assignment is the high quality north stars.
The north stars produce a variety of products and they are available in various stores. This product is commonly used in London by majority of the citizens. From the questionnaire carried out in the streets of London the general price that is acceptable to most users of the shoes varies between £50 to £150. This price that is being charged by various supermarkets and stores consist of the cost of purchase, cost of labour, depreciation of buildings, general administration expenses and other expenses that are involved in the selling of this product.
The price that will be used in this assignment is the average price determined from the questionnaire of this assignment. The average price for high quality North Star shoes has been assumed to be £ 110. The £110 is the price at which most respondent do agree that it is reasonable for high quality shoe to be traded in this market.
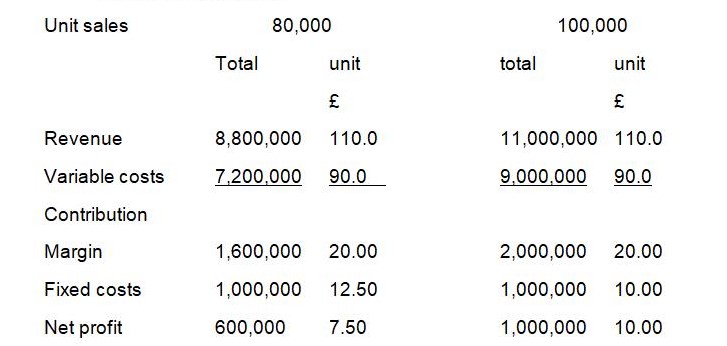
Assume a supermarket them sells for £110 per year and variable costs are £ 90 per unit. The present year volume of output is 80,000 units, but could be increased to 100,000. The analysis shows that total variable costs increase proportionally with output for unit variable costs are constant. If we assume that selling prices remain unaltered, costs savings themselves will lead to increased profitability. The contribution margin is an important concept in cost-profit analysis.
As may be seen from the example above, the contribution margin is calculated by deducting the variable costs from revenue. It is the first stage in calculating the net profit and measures the profit which is available to cover fixed costs. Since fixed costs are incurred irrespective of sales, a firm will make a loss if the contribution margin is insufficient to cover fixed costs. At low levels of output the firm will make a loss because fixed costs are greater than the contribution margin. As output increases so do the margin which will ultimately equal and then exceed fixed costs.
One of the most important uses of the distinction between fixed and variable costs lies in the analysis of these costs through different levels of production.
Unit cost statement

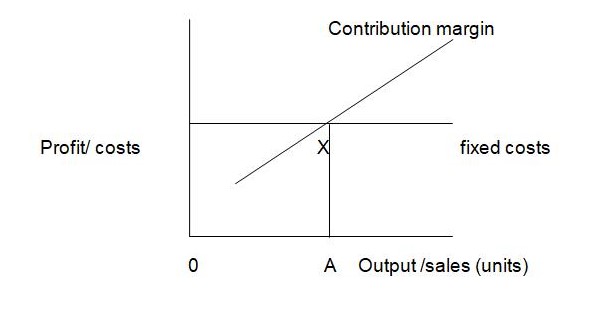
The relationship between fixed costs and contribution margin is illustrated below.

The critical point at which the contribution margin is equal to the fixed cost is known as the break-even point which indicates the level of output at which the firm makes zero points, that is, where total costs are equal to total revenues.
Break-even analysis
Break-even analysis focuses on the measurement of the breakeven point. Before we attempt any calculations, it is necessary to make certain assumptions about the behavior of costs and revenues. Thus, we assume that costs and revenue patterns have been reliably determined and that they are linear over the range of output that is being analyzed.
These assumptions also imply that costs may be resolved without difficulty into fixed and variable costs; that fixed costs will remain constant, that variable costs will vary proportionally with volume of output; and that all other factors will remain constant, that is, that selling price will remain unchanged, that the methods and efficiency of production will not be altered and the volume is the only factor affecting costs.
It is because these assumptions are difficult to maintain in a ‘real-life situation that breakeven analysis cannot pretend to be anything but a rough guide. Its real value to management lies in the fact that it highlights the relationships between the factors affecting profit, allowing management to make certain assumptions about these factors and see the likely effects of changes in these assumptions. Hence, breakeven analysis is useful as a management decision model.
In carrying this analysis several assumptions have to be made;
- Change the levels of revenues and costs arise only because of changes in the number of units sold. The number of output units is the only revenue driver and the only cost driver. Just as a cost driver is any factor that affects costs, a revenue driver is a variable, such as a volume, that casually affects revenues.
- Total costs can be separated into the affixed component that does not vary with the output level and a component that is variable with respect to the output level. Furthermore, variables costs include both direct and indirect variable costs of a product. Similarly, fixed costs include both direct fixed costs and indirect fixed costs of products.
- When represented graphically, the behaviors of total revenues and total costs are linear in relation to output level within a relevant range.
- Selling price, variable cost per unit, and fixed costs are known and constant.
- The analysis either covers a single product or assumes that the proportion of different products when multiple products are sold will remain constant as the level of total units sold changes.
- All revenues and costs can be added and compared without taking into account the time value of money.
The relationship between sales, variable and fixed costs, and profits may be expressed as an equation.
Sales = variable costs + fixed costs + net profit
At Break-even, the cost of production is equivalent to the sales revenue. In this case, the fixed costs 1000,000. The unit revenue is 110 while unit variable costs are materials 90 per unit. Therefore, breakeven analysis will be as
When they want to sell at 110 the break-even will be as follows:
Breakeven point = fixed cost
Contribution margin per unit
- Fixed cost = 1000,000
- Contribution per unit = selling price- variable cost
- Contribution = 110-90= 20
- Therefore, breakeven point = 1000,000/20 = 50,000 units of north stars shoes
In order for the dealer to be able to avoid, loses must produce and sell 50,000 units or more. Any less than that will be making losses.

The margin of safety
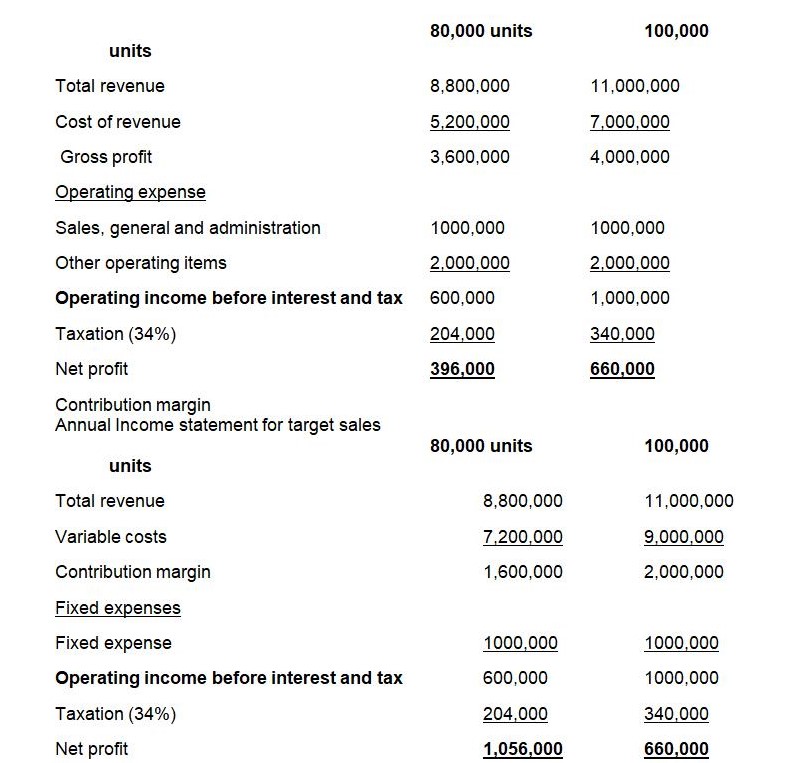
The margin of safety is the difference between the actual level of activity and the losses breakeven level of activity. For example, if the actual level of sales is 80% and the breakeven point lies at 60%. The margin safety level will be 30%. If the margin of safety is more than what the firm can do then the firm is in a difficult situation. Looking at the above activities we shall prepare a breakeven chart to assist in showing the margin level of safety.
Let us assume the following:
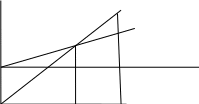
This is shown at the breakeven point between the sales curve and the total cost curve. This angle indicates the rate of increase in profit after the breakeven point. If this angle is wider then the profit will increase at a higher rate after the breakeven point and vice versa.

From the table above, the margin of safety for this firm is between 50,000 units and 100,000 units. Anything below 50,000 units will mean that the firm will be operating under a loss. The breakeven point chart used above has a number of limitations and various points that needs to be analyzed and these include:
- These are only true within specific levels of activities.
- Fixed costs may change at different levels of activity.
- Variable costs may not also give a linear trend.
- Managerial decisions can alter the fixed and variable costs.
- The relevant time factor can affect the chart.
Recommendations
The management of the supermarket should ensure that improves marketing strategies to ensure that it sells more than 50,000 units to break even. If selling becomes competitive then he will try to reduce expenses or increase the price of the unit. The price adjustment is more sensitive as compared to changes in units sold. However, market forces always determine the price and it may be beyond the store’s control.
Breakeven point analysis assists the management to predict the cost levels and behaviors of a certain sales activity level for the organization. This is so when the past conditions and the future expected changes are taken into consideration while predicting the cost to be used.
References
Ask, U, Ax, C. and Johnson’s (1996); cost management in Sweden: from modern to post modern management accounting.
Atril, P.F. and McLaney, E. J. (2002). Management accounting for non-specialists, 3rd edn (financial times prentice Hall).
Drury C; (2000); Management and cost Accounting;5th edition,business press Thomson Learning,
Drury, C. Braund, S., Osborne, P. and Tayles M. (1993). A survey of management accounting practices in UK manufacturing industries (The chartered association of certified accountants).
Horngren, C. T., Bhiman A., foster G., and Datar, S. M. (1999). Management and cost accounting (prentice Hall Europe).
Larson D, Kermit, Wild, J. john & Chippetta Barbara;(1996); fundamentals of accounting principle; London; Irwin.