Introduction
Crisis management is an essential strategy that organizations employ in the prevention and mitigation of hazards threatening to harm humans and property. Crisis management models are applicable in the assessment of terrorism and other risk events that are common in various organizations. Effective crisis management is possible when there is a reliable forecast of risks that a given organization faces. ISO-30000 offers an elaborate risk management process comprising risk identification, risk analysis, and risk evaluation. Risk identification enhances the forecast of risk for it entails an assessment of an organization, strategic operations, and social, political, economic, technological, cultural, and legal environment. Risk analysis provides a way of profiling risks and mapping them to specific areas requiring urgent attention, and thus, improving the reliability of the forecast. The review of risk identification and analysis requires risk evaluation to update the dynamics of threats and hazards that an organization faces.
The process of Threat and Hazard Identification and Risk Assessment (THIRA process) offers four phases of forecasting and handling risks. The first phase involves the identification of threats and hazards from humans, the natural environment, and technology-based on potential risks, experiences, and expertise. Contextualization of threats and hazards by describing their occurrence regarding time, location, and conditions promote the reliability of the forecast. The third phase of the THIRA process is the establishment of capability targets by undertaking the quantitative assessment of impacts such as the size of an area affected the number of displaced households, the number of injuries, the number of deaths, and the extent of infrastructure damaged.
The last phase entails the forecast of resources required to prevent the occurrence of threats and hazards as well as protect communities through recovery and mitigation strategies. The National Preparedness System has stipulated six steps of forecasting threats and hazards. These steps are identification and assessment of risks, estimation of capability requirements, creation and sustenance of capabilities, delivery of capabilities, validation of capabilities, and review and update of capabilities. The THIRA process and the National Preparedness System permit reliable prediction of risks and consequently plan for effective response to prevent and mitigate. In this view, the study seeks to undertake vulnerability and risk assessment of Rice University’s Baker Institute of Public Policy.
Vulnerability and Risk Assessment Practical Application Assignment
The following table identifies vulnerabilities and risk scenarios events of the Baker Institute of Public Policy at Rice University. The identified vulnerabilities and risk scenarios are flood, hurricane, earthquake, mass protest, campus shootings, terrorism, power outage, water outage, arson, electrical fire, robbery, cybercrime, sexual abuse, disease outbreak, political clashes, hostage situation, bomb threat, elevator failure, racial fights, and food poisoning. To assess the relative risk of each of the risk events, the assessment tool quantified the probability of occurrence, impact on students, impact on staff, impact on learning, the preparedness of the institution, and the effectiveness of mitigation measures.
Table 1: Vulnerability and Risk Assessment Tool for the Baker Institute of Public Policy at Rice University.
Risk assessment using the designed tool shows that the institution has a high probability of the occurrence of natural disasters such as a hurricane and flood and human actions such as cybercrime. The mean of the occurrence of risk events is 25%, which means that these events are unlikely to occur in the institution. Risk events such as hurricane, flood, earthquake, campus shootings, hostage situation, bomb threat, terrorism, arson, and electrical fire have a high or moderate impact on students, staff, and learning. On average, these risk events have a higher impact on learning (M = 2.4) when compared to staff (M = 2.25) or students (M = 2.24).
The assessment of the preparedness shows that the institution has moderate preparedness (M = 2) while the effectiveness of mitigation is also moderate (M = 2.2). The findings suggest that the institution needs to review its preparedness to enhance its effectiveness in mitigating the occurrence of risk events. The assessment of relative risks for flood, hurricane, and cybercrime 52.65%, 41.45%, and 61.15% respectively, which are relatively higher than those of other risk events. Mass protest, sexual abuse, political clashes, and food poisoning have relative risks of 25.1%, 32.58%, 24.74%, and 23.47% correspondingly. Other risk events have low relative risk values of less than 20%.
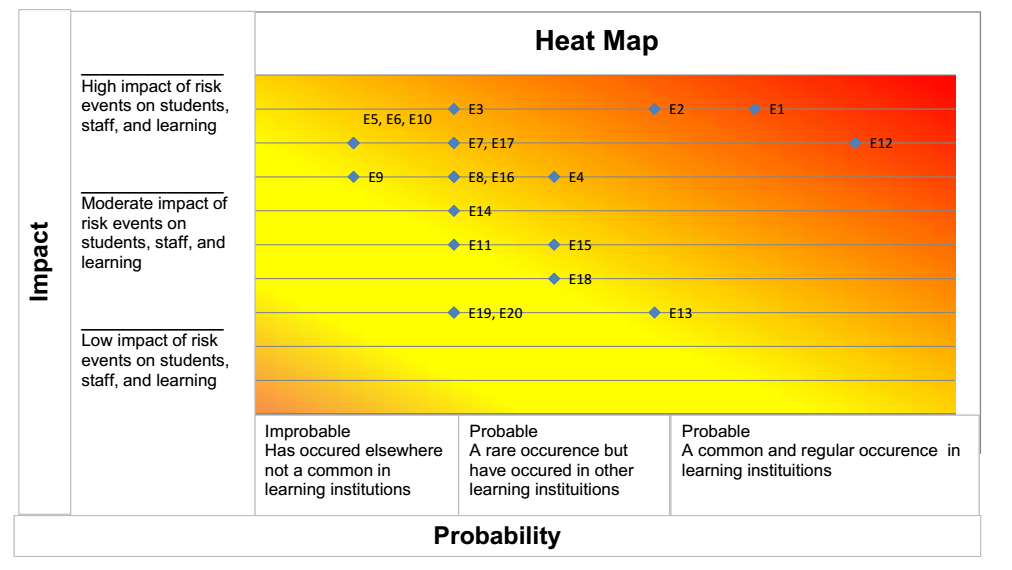
The data obtained from the assessment tool was used to generate a heat map to illustrate the distribution of risk events in terms of probability and impact on students, staff, and learning. The heat map shows that most risk events are probable and have a high impact on students, staff, and learners. However, few risk events are likely to occur and have high impacts on students, staff, and learners.

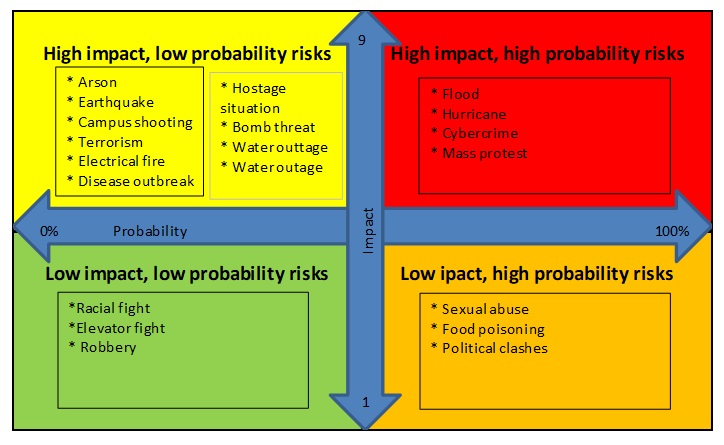
The risk matrix below classifies risk events into four categories depending on their probability level and impact level. Most risk events, namely, arson, earthquake, campus shooting, terrorism, electrical fire, disease outbreak, hostage situation, bomb threat, water outage, and power outage have probabilities lower than 30% and impact level of above 7. Flood, hurricane, cybercrime, and mass protest have high impact levels of greater than 7 and probabilities 30% and above. Racial fight, elevator fight, and robbery are risk events that have impacts lower than 7 and probabilities lower than 30%. Comparatively, sexual abuse, food poisoning, and political clashes are risk events that have low impact levels of less than 7 and high probabilities of 30% and above.

References
“Threat and Hazard Identification and Risk Assessment Guide’, DHS, Second Edition, 2013. Web.
“National Preparedness System”, DHS, 2011. Web.
“A Structured Approach to Enterprise Risk Management (ERM) and the Requirements of ISO-31000”, AIRMIC, alarm, IRM. Web.
Willis et al. (2005). Estimating Terrorism Risk. RAND. Web.
Poland, James M. “Understanding Terrorism: Groups, Strategies, Responses”. Prentice Hall, 2011. Chapters 2, 7, and 8.
Fink, Steven. “Crisis Management, Preparing for the Inevitable”. AMACOM, 1986. Chapters 6, 8, 10.