Introduction
Background
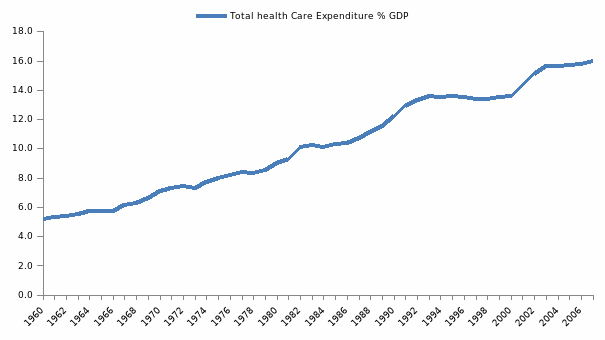
Health care demand has been increasing constantly in the US. According to the OECD data, the total expenditure on healthcare in the US as a percentage of GDP has continually increased (see figure 1). There has been a 17 percent increase in expenditure share in GDP from 2000 through 2007 and a huge 207.6 percent increase since 1960. The share has increased from 5 percent in 1960 to 16 percent in 2007 (OECD). This indicates that there has been a rise in demand for health care services.
This paper examines the demand for health care in the US. The question therefore arises is that what determines the demand for health in the US. Michael Grossman pointed out that demand for health or rather “good health” is a function of “shadow price” determined by various factors like age, education, income, etc. which is negatively related to heath demand (Grossman 225). Therefore, age is one of the key factors that affect the demand for health care.
Statement of Problem
The American population has been aging over the last few years and has been identified as one of the reasons for the rapid growth in health care expenditure (Newhouse 5). This increases the demand for a different health policy to tackle the aging population. Researchers have often posed the question – of the aging population is driving the healthcare demand in the US. Reinhardt has shown through his study that the aging population will have a strong effect on the health expenditure in the country and will put pressure on the labor market and economy of the country (37). Given this scenario, the logical question that arises is the demand for healthcare among the aging pupation and what factors drive the demand for the same.
Aim
This paper studies National Health Data of the US to establish a model for estimating the demand for healthcare among the older pupation of the country. The paper is important as it aims to demonstrate how the demand for aged pupation gets shaped. This research is important for policymakers, as it will indicate the autonomous factors that may help in determining the demand for health.
Literature Review
Research on Old Age and Demand for Health Care
The aging population in the US has been a concern for both the academician and policymakers alike. There has been a lot of research on the aging problem and the effect it was having on the health expenditure of the economy. These studies mainly focused on the macro-level analysis of aging and healthcare expenditure. Newhouse reports that the aging population has been increasing in America, which has increased the expenditure on median care (6).
Newhouse points out that even though there has been a rise in the aging pupation in the country, there has not been a substantial increase in the amount spent by individuals at hospitals. Thus, indicating just a marginal increase in the health care cost assuring from an increase in hospital expenditure. Therefore, the price of healthcare cannot be solely determined by the cost of hospitals or medical services as they indicate a partial scenario (Newhouse 12).
He points other that other cost factors like insurance have a greater impact on the health bill of individuals, especially the aging population, than others. Therefore, the demand for health will also depend on the cost of insurance, which is reflected through the expenditure done by individuals on health insurance. Other than this, another cost that has been mentioned by Newhouse is expenditure on prescribed medical bills. This demonstrates the amount consumers spend on the purchase of medicine for their treatment. This is not reflected in the number of bills paid for hospitalization. Newhouse, therefore, concluded that demographic variables played a minor role in the increase in healthcare expenditure.
He showed that between 1950-87, the change in healthcare was by 15% due to demographic change, whereas the health care expense of the US increased by five times. Therefore, he concludes that age is not a determining factor in the increase of health care expenses. In another research, Westerhout (27) showed that there has been an increase in GDP share in healthcare expenditure due to the aging pupation. However, no study has tried to identify the demand for healthcare and the factors that affect the healthcare of the older pupation.
Zona and Muysken have shown in their research that an increase in income has affected the preference or demand for health positively, which has led to a decline in growth (170). Thus, they point out that information on human capital is necessary for growth. They point out that good health is a necessary condition for people to continue their productivity in the labor force. Further, they also show that health is produced under conditions of decreasing return to Investment. Therefore, this indicates that health care is reduced, and the labor is shifted to the human capital, then growth will fall. In terms of aging pupation, this
This paper on the aging population of the US concentrates on identifying the demand function for health for the older pupation of the country and the factors that affect their demand. For this research, Grossman’s model for demand for health is used.
Grossman’s Model
Michael Grossman did one of the seminal works in estimating demand for medical care from the point of view of the patient as the sole actor in taking health care decisions. Grossman conjectured that the demand for medical care is a derived demand as medical services are not consumed as an immediate need, rather, to maintain or improve on a certain other good that i.e. good health (Grossman 234). Therefore, health was considered to be a durable good. Thus, it must be noted that as Grossman presented the decision to health care from an individual point of view, therefore, “it represents a suitable behavioral model to describe the demand for initial contacts, which are usually initiated by the patient” (Pohlmeier and Ulrich 341).
Gossman’s model is based on demand for health as an investment towards better health, which would help the individual to work more. In this model, he considers health as the end product of a productive process, and the individual chooses his utility maximization. In a more simplified assumption of the Grossman model, when only one period is considered, then the utility (U) of the aged people will depend on health (H) and consumption (C).
Healthcare can be expressed as a production function, which is based on health inputs (M) and that helps in the transformation of health. Grossman uses the concept of production function embedded into the theory of consumer behavior to establish the difference between health as an output and healthcare services as one of the many inputs to produce the desired output (Grossman 228). Therefore the health function derived is H(M, C) wherein, H’>0 and H’’<0 (Wagstaff 94). From this function, the marginal product of M is found to be an increasing function of the resources for health and the availability of technical knowledge.
Therefore, whenever, there is a technological breakthrough in medicine, it is expected to increase H’. This also indicates the individuals who have a higher level of education will have better knowledge about health care and services than the lesser educated people. Thus, the budget constraint can be derived using the last two premises
- PcC + PmM = Y
where Pc and Pm are the prices of consumption (C) and healthcare (M) respectively. Y is the income which is the maximum limit of the available money to be spent and is used as a “proxy command over resources” (Wagstaff 93).
Therefore, Grossman points out that individuals choose C and M to maximize U subject to the constraint function and health production function. Therefore at an optimum level
- U1/U2 = π/Pc ≡ [Pm/H’]/Pc
Here π is the cost incurred by the consumer to create an extra unit of health. For deriving the demand for health care by the aging population, it must be noted that as people grow old their capacity to contribute to the production
For this study, it is assumed that the rate of depreciation varies with age. Grossman asserts that an individual gains an initial stock of health, which depreciates with age. This depreciation is at an increasing rate after some period of the life cycle and this can be increased by increasing investment in healthcare (Grossman 237). Grossman points out that the gross investments made by an individual are in the form of health variables like medical care, diet, cigarette smoking, alcohol consumption, and exercise.
Thus, following Grossman it is assumed, that as individual ages, his capacity to work and contribute to production reduces due to a reduction in physical capacity, therefore, increasing the depreciation in health stock of the individual. Thus, the demand for health changes with change in the rate of depreciation with age. Thus, Grossman postulates that health capital falls over age (Grossman 238). However, Grossman points out that even when there is a fall in the demand for health capital by the consumer, there will be a fall in the supply of health capital, as the gross investment falls (238).
Thus if there is an excess supply of health capital, then individuals will have a greater incentive to close the gap by increasing gross investment. Conversely, if the change in supply were lesser than the change in demand for health capital, the gross investment will fall over the life cycle (Grossman 239). Therefore, to understand the demand for health care by the aging population, the change in the supply of health care must be greater than the change in demand for health capital to increase gross investment over the life cycle.
Thus, following Grossman’s model, it can be deduced that health, as a commodity is obtainable through investment made by individuals in the health capital and other commodities. The health capital and another commodity together form the budget constraint for the individuals. For this research, health is taken to be a function of health care available to the aged Americans.
Data
The data is collected for the US from national surveys. The main data is collected from the American Community Survey (U.S. Census Bureau), and statistics of the aging population of the US from the US Census Bureau Decennial Census (Federal Integrated Forum for Aging-Related Statistics). Information in income and expenditure has been derived from the Bureau Of Labor Statistics website (Bureau of Labor Statistics)
Figure 2 shows the consumer expenditure by consumers of all ages and expenditure of 65+ cohorts on health care only.
The figure distinctly shows that for the period under study, there has been a higher average expenditure by people over 65 years on health care than the overall average expenditure on it in the US for all ages. This demonstrates that the demand for health care is higher for older people. For this research, we consider old people higher than 65 years of age. Further, the change in health care expenditure made by the alder generation has fluctuated over the period from 1995 to 2008. This indicates that the demand for health care has fluctuated, and it has declined considerably in 2006-07 for individuals above 65 years. The question that will be tried to answer in this paper is what changed the demand for healthcare in this age cohort.
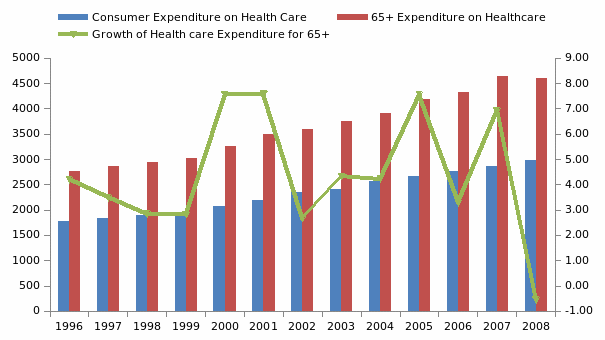
Table 1: Descriptive Statistics.
The data shows that the data collect for the research is shown through the descriptive statistics table below (see Table 1). All the data are collected for the years 1995 to 2006. The study descriptive table presents the mean, median, standard error, standard deviation, variance, skewness, and kurtosis of the sample data used for the study. The empirical research uses data from the variables that will be considered for determining the demand for health following Grossman’s model are self-reported health status, days lost due to hospital/illness, income, price of hospitalization, and education level.
The demand for the good health of an individual will depend on the amount of the level of education, which is divided into two groups viz. high school and higher and Bachelor and higher. The effect of these two levels of education will be seen on the demand for health. The mean value of the first variable is found to be 69.3 while that of the second variable is found to be 16.2. This indicates that on average 69% of the population has the education of high school or above in the period under study, and 16.2% of the 65+ individuals have an educational background of Bachelor or above.
The second variable that is taken for the research is the average number of days spent by the individual in the hospital. This shows the number of days a sick a person has been sick. 6.1 give the mean average number of days a person has been in hospital. The average income of people above 65 years is $22943.4 for 1995 through 2006. The mean value for the consumer expenditures is found to be as follows – food is 3759.5, health care is 2278.7, health insurance is found to be 1825.2, and medical services are 634.92. The demand for health will depend on this independent variable.
For this research, following Grossman, it is believed that health, as a desired commodity is dependent on various factors like educational attainment, expenditure, and average time spent in hospitals. Education is one of the most important determinants of health as determined by Grossman. Education in terms of production function provides efficiency to the producer. Similarly, in the case of health, education is expected to play a positive role to gain a greater amount of health. of good health. The producers’ price index (PPI) is taken as a measure for the price paid by the people to attain services in hospitals.
Therefore, the mean PPI for hospitals is found to be 126.1. This would provide the amount of price paid by the individuals to attain good health. The mean income for people above 65 years is found to be $22943.4. This variable is used to determine the budget constrain for the individual. The consumer expenditure on goods related to health and health-enhancing commodities is found to be food, health care, health insurance, and medical services.
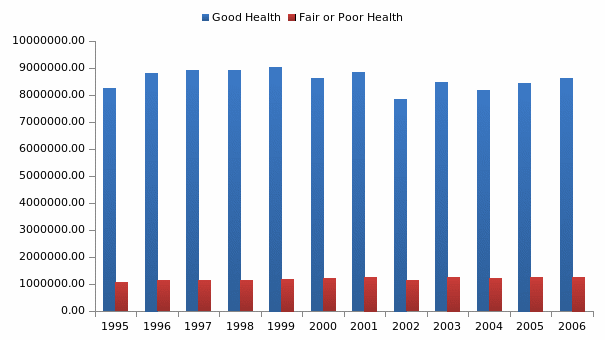
The dependent variable is the self-reported health status of the individuals above 65 years of age. Figure 3 shows the number of people above the age of65 report that their health condition is good (indicated by the blue bar) and fair and poor (indicated by red bar). Health status reporting is a measure used to understand the number of people who felt that good health was a part of their well-being and perceived it to be a desired commodity. Therefore, in order to produce this good health, different actions are taken for instance investment in insurance, or expenditure on food, etc. further, attainment of education also helps in betterment of health stock.
In case of applying this model to the old age cohort of above 65 years, it must be noted that most of the people above the age of 65 years are retired. Therefore, the time left for living becomes another factor that determines the demand for good health for people. Moreover, it is conjectured that with increase in age, as the life expectancy declines, there is a greater demand for good health, and therefore, heath care. Thus, increasing the cost incurred on heath. Therefore, the desire to live is the time that the individual is expected to live for the next period of his life, and that is the time he intends to maximize through investment in health bettering avenues. Thus, life expectancy at 65 is embedded into the utility function of health. The following section will describe the statistical analysis that is undertaken using the data collected.
Data Analysis
The analysis will first establish a correlation all the variables that are being studied. The correlation analysis is presented in table 2. The table shows that for people above the age of 65 years, the correlation between self reported good health and the other independent variables.
Table 2: Correlation Analysis.
The data in Table 2 shows that good health has a strong negative correlation with length of days in the hospital, indicating, that as there are higher days in the hospital, people would be in a greater position to lose their stock of good health, as the depreciation of investment made on health over the years. Further, the correlation analysis shows that there is a strong positive relationship between life expectancy at 65 and health status. As reported earlier, with higher life expectancy, there will be greater confidence in having good heath, thus, reducing the demand for health care, and increasing the demand for health.
Thus, as people expect that they will live longer, and will have a greater time to remain productive, there is a lesser demand for heath and therefore less demand for health care. This corresponds to the assertion of Zona and Muysken who point out that the main aim of the aged pupation is more to reduce proximity to death than to attain better health (Newhouse 19). However, as there is a decline in life expectancy, there will be an increased demand for health which will be reflected through a higher level of investment in healthcare, thus, increasing health care demand. However, this study postulates that though life expectancy can be a good indicator for health demand, there is a strong relationship between good health demand and life expectancy.
Demand for good health is found to have increased over the years, as there has been an increase in the PPI of hospitals. Good health has a stronger relationship with higher education level than at lower education level, indicating that good health is contributed more with higher education. Further, the popular assertion that with an increase in income, there is a higher demand for health care (Zona and Muysken) is substantiated through this correlation analysis.
The correlation is found to be 0.94, which is a strong correlation with good health, and therefore, indicates that higher is income, higher in the level of good health. Further, health is found to have a strong positive correlation with higher expenditure made on food (0.98), health care (0.98), and health insurance (0.99). However, a relatively less strong positive relation (0.68) is identified between good health and medical services expenditure.
Regression analysis is done to form the demand equation for good health. For the analysis, the self-reported status of health is taken as the dependent variable. According to the Grossman model, the desired commodity of an individual is ‘good health’. Therefore, a linear regression analysis will be used to determine the expected relation between the desired ‘good health’ of people above 65 years. The independent variables, which are found to be strongly related to good health from the correlation analysis, are presented in table 3. The regression analysis results are explained below.
Table 3: Regression analysis for good health.
The regression statistics given in the first table of table 3, gives the value for Multiple R, which has the value 0.997. This shows that there exists a very strong relation between the dependent variable good health with the independent variables taken for the study as it is value is very close to 1. As the Multiple R is found to be very close to 1, it can be intuitively concluded that there exists a very strong relation between demand for heath and PPI for hospital, education, consumer expenditure, and income variables. Therefore, it can be states that the least square regression line for good health will fit in to the data points. Further, a linear relation between good health and the independent variables is also established through a high value of Multiple R.
The ANOVA table presents the ANOVA analysis for the regression analysis. This data when considered presents the coefficients that would help us generate the demand for good heath equation. There the regression equation thus derived is
Health = -196 + 0.57 PPI of Hospital – 23.8 Length of Stay at hospital -0.00373367 Income + 0.08 Health Care + 0.16 Health Insurance + 0.149 Medical Services
Therefore the least-square regression line shown above demonstrate that for old individuals above the age of 65 years, if the PPI level increases by 10% there will be an increase in demand for health by 0.57*10% indicating an absolute increase of -0.571. Similarly, there would be an increase in the heath when there is an increase in consumption of health care, which indicates availability of health care too, health insurance, and medical services. As the significance F is less that 0.05 at 95% significance level, the overall analysis is statically significant indicating that the established least square equation can be extended into a model.
As health increases, there will be a lower demand for health care. However, when there is a longer stay in the hospital, there would be a decline in health, thus increasing the demand for health care. Intuitively it can be argued that as there is an increase in the expenditure of 65+ people in health insurance, medical service, etc. there is also increased health, which inversely reduces the demand for medical services.
Conclusion
The significance of the study is a derivation of a demand function for good health in the US. The study shows that, as there is greater investment in health and food, which results in higher and better health quality. This inversely reduces the demand for health care. Income is found to hurt health i.e. higher income results in lower health, which may be due to overexertion at the age of 65 or above, or consumption of goods, which are harmful to the health.
Therefore, at higher income levels there is a greater demand for healthcare. However, with lower income, health care demand also reduces. Higher insurance consumption results in greater health perception, which reduces the demand for medical services. Therefore, for policymakers, it is important to note that at an age above 65 years, that if the health care facilities and consumption of health-giving products like food can be increased, there will be the availability of better health for the older people, and therefore, less requirement for health care facilities.
Bibliography
Bureau of Labor Statistics. 2010. Web.
Federal Integrated Forum for Aging Related Statistics. 2010. Web.
Grossman, Michael. “On the Concept of Health Capital and the Demand for Health.” The Journal of Political Economy, Vol. 80, No. 2. (1972): 223-255. Print.
Newhouse, Joseph P. “Medical Care Costs: how much Welfare Loss?” The Journal of Economic Perspective, Vol. 6, No. 3 (1992): 3-21.Print.
OECD. “Health Data.” 2010. Organization for Economic Co-operation adn Development. Web.
Pohlmeier, Winfried and Volker Ulrich. “An Econometric Model of the Two-Part Decisionmaking Process in the Demand for Health Care.” The Journal Of Human Resources, Vol. XXX, No. 2 (1995): 339-361. Print.
Relnhardt, Uwe E. “Does The Aging Of The Population Really Drive The Demand For Health Care?” Health Affairs, Vol. 22, No. 6 (2003): 27-39. Print.
U.S. Census Bureau. U.S. Census Bureau. 2010. Web.
Wagstaff, Adam. “The Demand for health: A Simplified Grossman Model.” Bulletin of Economic Research, Vol. 38, No. 1 (1986): 93-94. Print.
Westerhout, W. M. T. “Does Ageing Call for a Reform of the Reform of the.” CESifo Economic Studies, Vol. 52, No.1 (2006): 1–31. Print.
Zona, Adriaan van and Joan Muysken. “Health and endogenous growth.” Journal of Health Economics, Vol. 20 (2001): 169–185. Print.