A group of college students (N=16) was enrolled in a study that aimed at finding out their performance in math and writing courses. The group comprised of both female and male respondents as the categorical variable for gender (Sirkin, 2006). The age of the participants was also taken and profiled as a ratio variable. Both the gender and age variables represented the demographic variables of the research sample (Newby, 2010). On the other hand, the sample’s math and writing scores were also recorded using the ratio level of measurement (Rosenthal, 2011). In summary, the study focused on four variables that were entered into the SPSS program as accurately as possible to avoid compromising research validity (Trochim, 2006).
Descriptive Analysis
To analyze the students’ performance, the study started with descriptive statistics using the SPSS software (Verma, 2013). The results were summarized as indicated in table 1 below.
Analysis of the Age of the Participants
Based on table 1 above, the minimum and maximum ages of the group were 18 and 32 years respectively. This represented an age range of 14 years. The median age of the sample’s distribution was 24 years while the mode was 19 years. The mean age of the sample was 24.25 years with a standard deviation of 4.30 years. Since the mean (24.24) and the median (24.00) were almost equal, it was interpreted that a majority of the students in this class were within this age range. However, given an age range of 14 years and a standard deviation of 4.30 years, it was concluded that the ages of the students were far spread away from the group’s mean of 24.25 years.
Analysis of the Students’ Math Score
The minimum and maximum math scores of the group were 84 and 96. Since the maximum score is expected to be 100, the unit of analysis was expressed in a percentage. Given the groups’ minimum and maximum scores, a score range of 12% was observed in the math course. The median score of the sample’s distribution was 90.5%, while the mode of the most repeated score was 90%. The mean math score of the sample was 90.81% and the standard deviation was 3.2%. The median (90.5%) and the mean of the group (90.81%) were almost equal, suggesting that a majority of the students’ scores in this class ranged between 90.5 and 90.81%. However, given that the overall range of scores in the math course was 12%, a standard deviation of 3.2% of a sample of 16 participants was large enough to conclude that student scores were far spread away from the group’s mean of 90.81% (Gibson, 2013).
Analysis of Students’ Writing Score
Out of the possible 100 points, the minimum and the maximum writing score of the group were 80% and 97%, respectively, which represented a score range of 17%. The median and the mode scores of the sample’s distribution were both tallied at 90.0%. The mean score of the group was 89.56% and the deviation was 5.1%. The median (90.0%) and the mean of the group (89.56%) did not differ significantly, indicating that a majority of the student’s scores for the writing course fell within this range. Worth noting is that a standard deviation of 5.1% of a sample of 16 participants and a score range of 17% was quite alarming. Thus, it was concluded that the student’s scores in the writing course were far spread away from the group’s mean of 89.56%.
Relationship Between Performance and Gender
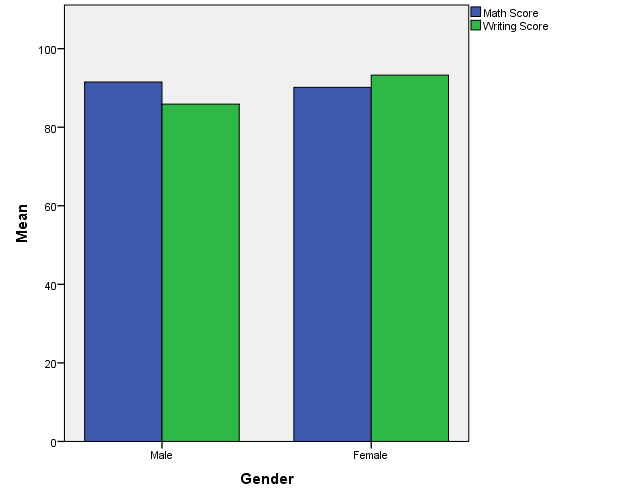
The study investigated the relationship between the gender of the students and their writing and math scores. A clustered bar graph (figure 1 below) was used to depict this data (Pallant, 2016). The finding depicted that the mean math score among male students (approx. 90.0%) was almost equal to that of the female students (approx. 88.0%). Concerning the writing score, males (approx. 85.0%) performed slightly lower than did their female counterparts (approximately 90%).

Relationship Between Age and Performance
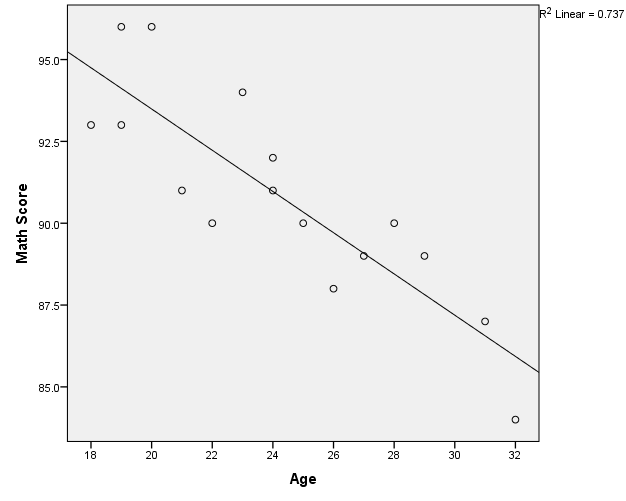
Using a scatterplot diagram that included the line of best fit (Pallant, 2016), the researcher investigated whether there was a relationship between the age of the students and their scores in math. The findings revealed that as the age of the students increased, their performance decreased significantly. Using the Pearson Correlation Coefficient (R2), it came out clearly that an increase in age by one unit resulted in a 0.737 decrease in math score. This finding suggests that old age makes it difficult for students to perform better in mathematics. The results are presented in figure 2 below.

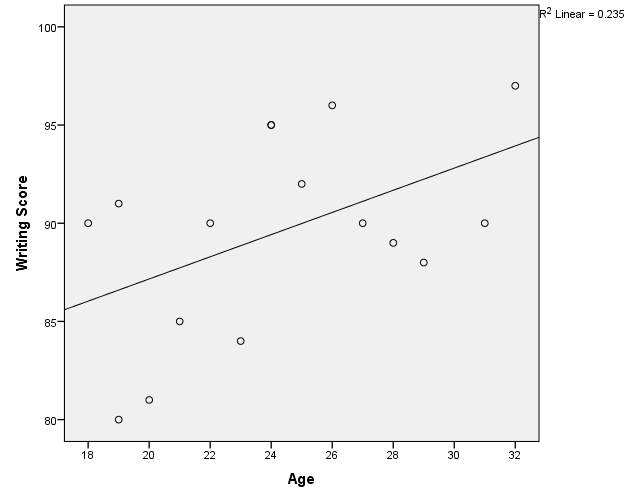
Another scatterplot was used to investigate the relationship between the age of the students and their writing scores. From the findings, it was established that as the age of the respondents increased so did their scores in the writing course. Using the Pearson Correlation Coefficient (R2) of the distribution (Macfarland, 2013), an increase in age by one unit resulted in a 0.235 increase in students’ writing scores. A conclusion was reached that old age translates to the great experience in the writing skills of the students and hence high scores in the writing course. These results are presented in figure 3 below.

References
Gibson, J. (2013). Empirical rule of standard deviation. Texas, USA: Math Tutor DVD LLC.
Macfarland, T. W. (2013). Data Exploration, Descriptive Statistics, and Measures of Central Tendency. An introduction to data analysis and graphical presentation in biostatistics with R Springer briefs in statistics (5-16). Web.
Newby, P. (2010). Research methods for education. Harlow, England: Pearson Education Ltd.
Pallant, J. (2016). SPSS survival manual: A step-by-step guide to data analysis using IBM SPSS. Crows Nest, NSW: Allen & Unwin.
Rosenthal, J. A. (2011). Statistics and data interpretation for social work. New York, NY: Springer.
Sirkin, R. M. (2006). Statistics for the social sciences. Thousand Oaks, CA: SAGE.
Trochim, W. (2006). Sampling: External validity.Research Methods Knowledge Base. Web.
Verma, J. P. (2013). Data analysis in management with SPSS software. New Delhi, India: Springer.