Project Topic
This project asked for descriptive statistics analysis for the data collected in the poll. The variable of interest was the respondents’ scores on the last final math test. The test was scored on a hundred-point scale so that respondents could have the maximum value of 100. Thirty-five individuals gathered through social media were invited to participate as a sample for the survey.
Background Information
The study of statistics related to student achievement allows for the creation of a time slice and an assessment of the dynamics of such changes over time. In addition to forming an understanding of how well students did on a test, descriptive statistics also allow for the estimation of central and variance trends of such distributions (CFI). This helps to determine the substantial variance in the data and thus provides an estimate of how strong the group of students as a whole was.
Methodology
The sample was constructed on a systematic probability mechanism, meaning that each member of the population had an equal chance of being in the sample (McCombes). This included writing out all contacts from social media (Facebook, Instagram, WhatsApp, Telegram, Twitter) with whom the author of this project knew personally and knew for sure that they had taken the final exam in mathematics last year. Each row in the spreadsheet was assigned a random number using =RAND(), and then the data was sorted in ascending order. Every even number on the list was included in the sample: such respondents received an invitation to participate and had to answer just one question.
Data
Table 1 contains the data collected from 35 respondents in the survey. It is this scoring data that will be used for further statistical analysis.
Table 1. Raw data collected from respondents in the survey
Analysis
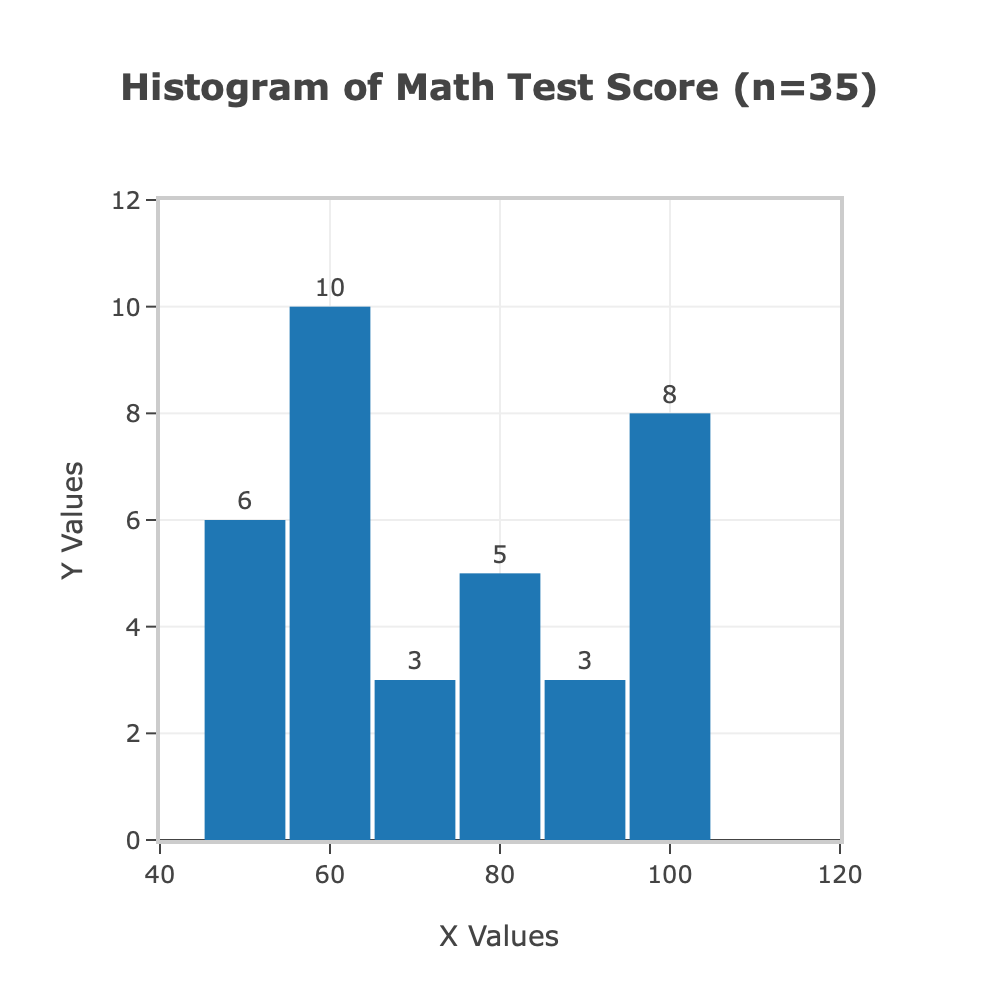
Table 2 shows the results of the statistical analysis performed. It shows that the average score for the final test was 71.69 (SD = 19.16), with a median value of 66. Figure 1 reflects the distribution of students’ scores: it can be seen that scores were not scored evenly, that is, there were those students who scored the highest and those who scored the least. Notably, none of the respondents scored less than 46 points, but only one of them was able to score 100.
Table 2. Results of calculations of descriptive statistics

Figure 2 shows a boxplot summarizing the five sample scores. As can be seen from this boxplot, there were no outliers in the set. The bias in the median boxplot also confirms that a sizable proportion of respondents tended to score low on the exam.

Interpretation
This statistical analysis aimed to determine overall performance trends among the math students who took the final exam last year. This information is of high academic value to the school community because it allows preliminary conclusions to be drawn about last year’s students and, by further comparing this data at the interim school, to assess performance trends. This can be especially useful when the teaching community’s standards or methods have changed in the current year, and examining such dynamics allows one to evaluate the new program’s effectiveness.
The results of the descriptive statistics obtained indicate that a large proportion of students tended to score low on the final exam. Only 37% of respondents (n = 13) could score above or equal to 80 on the test. This is somewhat contrary to expectations, which I believe most students did well. This may indicate poor performance last year or problems many students may have had, including exam stress or a pandemic. With some caution, these findings can be extrapolated to all students who took the exam last year, but this should be evaluated separately.
Conducting the study was not difficult and would not have affected the project. However, a larger sample is recommended for future surveys to minimize data bias. This could include expanding the sample to systematize students by school, district, or teacher. Finding connections between scores, demographic characteristics, and perceptions of stress may also be a valuable project extension.
Works Cited
CFI. “Descriptive Statistics.” Corporate Finance Institute, Web.
McCombes, Shona. “Sampling Methods | Types, Techniques, & Examples.” Scribbr, Web.