Introduction
Geysers comprise natural phenomena that attract tourists at Yellowstone National Park. The understanding of geysers regarding the waiting time for eruptions and duration of eruptions would enhance accurate predictions of their incidences and occurrences. Statistical analysis of the duration of eruptions and waiting time for occurrences could provide trends and patterns of geysers. In statistical analysis, descriptive statistics play a central role in the exploration of data because they reveal patterns and trends, which characterize and summarize a given data effectively. Therefore, the purpose of the coursework is to explore data collected from Old Faithful geysers at Yellowstone National Park with 299 eruptions by examining descriptive statistics of waiting time and the duration of occurrences.
Descriptive Statistics
Table 1 provides measures of central tendency, namely, means, modes, and medians of the waiting time for eruptions and the duration of eruptions in minutes. The waiting time for eruptions has a mean of 72.314, mode of 78, and median of 76. Since the mean, mode, and median are not equal, it implies that the distribution of the waiting time for eruptions has skewness. Specifically, the data for the waiting time exhibit negative skew in distribution because the mean is less than the mode and median. Comparatively, the duration of eruptions has a mean of 3.461, mode of 4, and a median of 4. In the same manner, as the waiting time for eruptions, the duration of eruptions has a negatively skewed distribution because the mean is less than both the mode and the median. Thus, the analysis of the measures of the central tendency indicates that modes and medians for both the waiting time and the duration for eruptions do not cluster around their respective means.
Table 1. Descriptive Statistics for Geysers’ Waiting Time and Duration of Eruptions
Table 1 also provides measures of dispersion, viz., standard deviation, variance, range, maximum value, and minimum value. The waiting time for eruptions has a standard deviation of 13.890 and a variance of 192.941, which means that the distribution deviates considerably from the mean (M = 72.314±13.890). The dispersion of the waiting time for eruptions is high because it varies from 43 to 108 with a range of 65. Since the data of the duration for eruptions has a standard deviation of 1.148 and variance of 1.318, it implies that the distribution does not deviate markedly from the mean (M = 3.461±1.148). The duration for eruptions has a low dispersion level because the data varies from 0.833 to 5.45 with a range of 4.617. Therefore, the comparative analysis indicates that the waiting time for eruptions has a high level of dispersion, whereas the duration for eruptions has a low level of dispersion.
Histogram and the Normality of the Distribution
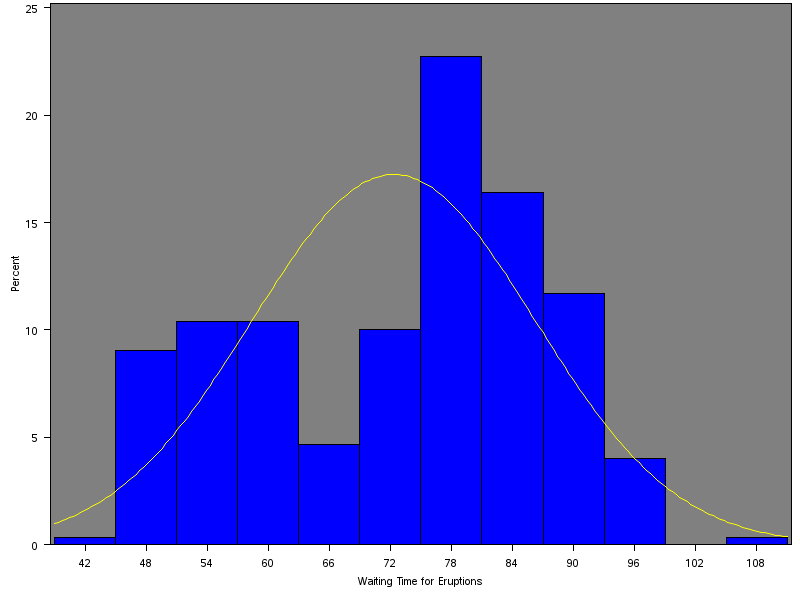
The histogram for the waiting time for eruptions (figure 1) indicates a bimodal form of the distribution. The first modal distribution occurs between the waiting time for eruptions between 42 and 66 minutes, while the second modal distribution occurs between 66 and 108 minutes. However, the distribution has a negative skew that deviates from the normal distribution because the first modal distribution (54-60) forming 10% is less than the second modal distribution (78) constituting about 22%.

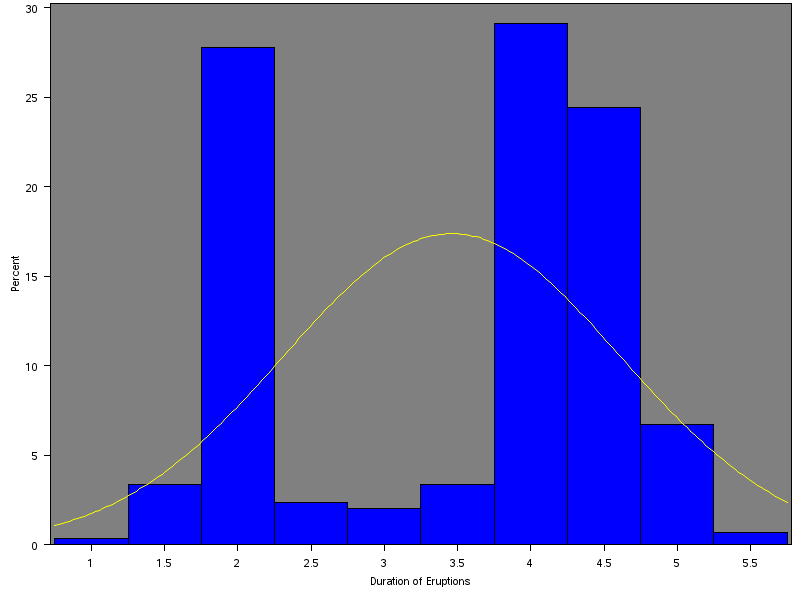
Figure 2 is a histogram that depicts the existence of a bimodal distribution in the duration of eruptions. The first mode of 2 minutes forms about 27%, while the second mode of 4 minutes consists of approximately 28%. Thus, the existence of the approximately equal proportions of the two modes in the bimodal histograms indicates the duration of eruptions has significant outliers that make the distribution possess a negative skew. Specifically, outliers occurring at 2 minutes and representing about 27% of the distribution distorts the mean because over 50% of data points are more than 3.5. Therefore, the distribution of data does not follow the normal distribution due to the presence of outliers, which creates the second model in the distribution.

Learning Outcomes
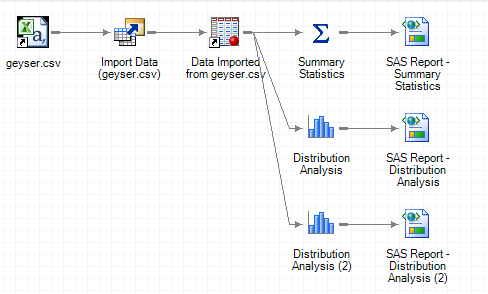
In the data analysis, I have learned how to import data into SAS, perform descriptive statistics, and determine the normality of data using the histogram. Figure 3 shows the process flow employed in the analysis of data using SAS. From a statistical point of view, I have learned that measures of central tendency, measures of dispersion, and the pattern of distributions offer an adequate characterization of data.

Conclusion
Data analysis shows that geysers in Old Faithful, Yellowstone National Park, vary in the aspects of the time taken to erupt and the duration of eruptions. An average time for waiting eruptions is 72.314 minutes, while that of the duration of eruptions is 3.46 minutes. The histogram depicts the existence of negative skewness since the distributions of both variables do not follow the normal distribution. The presence of bimodal distribution in the waiting time for eruptions and the significant outliers in the duration of eruptions contributes to the skewness of data.