Discovering Statistics Using IBM SPSS Statistics Case Study

Exclusively available on Available only on IvyPanda® Written by Human No AI

Figure 1 below shows that the average rainfall and runoff fluctuates from one year to another with a similar variation trend.
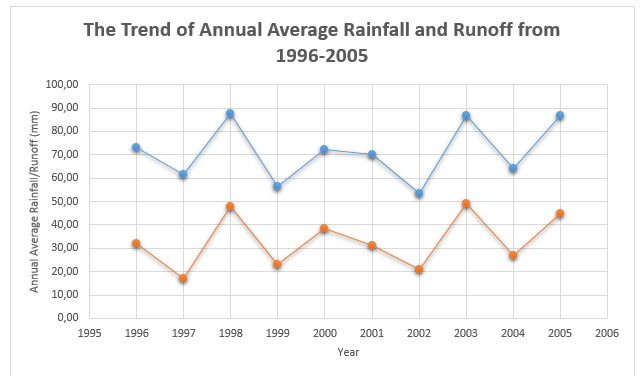
The Trend of Annual Average Rainfall and Runoff from 1996-2005
Figure 1. The Trend of Annual Average Rainfall and Runoff from 1996-2005.

The scatter plot shows that the annual average rainfall and runoff have positive relationships (Figure 2). The regression line indicates that the annual average rainfall accounts for 90.36% of the annual average runoff variation. Field (2017) explains that coefficient of determination (R-square) indicates the degree to which a predictor influences a response variable.

Scatter Plot Showing Relationships Between Annual Average Runoff and Rainfall
Figure 2. Scatter Plot Showing Relationships Between Annual Average Runoff and Rainfall.

Figure 3 depicts the seasonality in monthly averages of rainfall and runoff. November, December, and February have the lowest rainfall and runoff, while June, July, August, September, and October have the peak levels of rainfall and runoff. Comparatively, March, April, and May have moderate levels of rainfall and runoff.
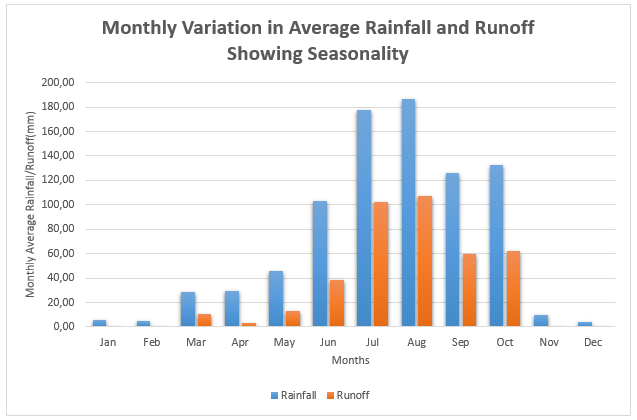
Monthly Variation in Average Rainfall and Runoff Showing Seasonality
Figure 3. Monthly Variation in Average Rainfall and Runoff Showing Seasonality.

Figure 4 reveals that monthly average rainfall and runoff have a positive relationship. The monthly average rainfall explains 97.23% of the variation in the monthly average runoff.

Scatter Plot Showing Relationship Between the Monthly Average Runoff and Rainfall
Figure 4. Scatter Plot Showing Relationship Between the Monthly Average Runoff and Rainfall.

Rainfall and runoff have a positive correlation, as shown in the scatter plot below (Figure 5). Rainfall accounts for 93.68% of the variation in the runoff.

Scatter Plot Showing the Relationship Between Rainfall and Runoff
Figure 5. Scatter Plot Showing the Relationship Between Rainfall and Runoff.

Reference

Field, A. P. (2017). Discovering statistics using IBM SPSS statistics. SAGE Publications.

More related papers Related Essay Examples
Cite This paper
You're welcome to use this sample in your assignment. Be sure to cite it correctly

Reference

IvyPanda. (2022, August 26). Discovering Statistics Using IBM SPSS Statistics. https://ivypanda.com/essays/discovering-statistics-using-ibm-spss-statistics/

Work Cited

"Discovering Statistics Using IBM SPSS Statistics." IvyPanda, 26 Aug. 2022, ivypanda.com/essays/discovering-statistics-using-ibm-spss-statistics/.

References

IvyPanda. (2022) 'Discovering Statistics Using IBM SPSS Statistics'. 26 August.

References

IvyPanda. 2022. "Discovering Statistics Using IBM SPSS Statistics." August 26, 2022. https://ivypanda.com/essays/discovering-statistics-using-ibm-spss-statistics/.

1. IvyPanda. "Discovering Statistics Using IBM SPSS Statistics." August 26, 2022. https://ivypanda.com/essays/discovering-statistics-using-ibm-spss-statistics/.


Bibliography


IvyPanda. "Discovering Statistics Using IBM SPSS Statistics." August 26, 2022. https://ivypanda.com/essays/discovering-statistics-using-ibm-spss-statistics/.

If, for any reason, you believe that this content should not be published on our website, please request its removal.
Updated:
This academic paper example has been carefully picked, checked and refined by our editorial team.
No AI was involved: only quilified experts contributed.
You are free to use it for the following purposes:
  • To find inspiration for your paper and overcome writer’s block
  • As a source of information (ensure proper referencing)
  • As a template for you assignment
1 / 1