The home prices always vary, and various determinants set them within the market sector. One of the variables that are important in determining the home price is the economic indicators. The ability of individuals to purchase a new home will always depend on the prevailing economic conditions. This means that when there are increased employment opportunities, more businesses, and household income, there will be a lot of cash circulating among the people, influencing their ability to make a home purchase. The other variable that will determine the price of a home is the neighborhood. When the landlords or people selling homes are setting their prices, they always do market research to determine how many similar units are going in a particular place. The prices will majorly be in line with those of the neighborhoods. Moreover, the economic activities and the potential for expansion in a specific area will be another important consideration when setting the prices of the homes. When the site can create more employment and or a significant target by most investors, automatically, the costs of the homes in such areas will be high. Such neighborhoods are always lucrative and will attract most investors.
The data obtained from the calculation of the mean, median, range, and standard deviation of each variable indicates that all the variables tend to be distributed in a skewed pattern. This is as shown in the table below;
This is a statistical presentation that involves a large sample of data with different values. This means that the data will not be distributed symmetrically. Hence, for this data, it is in a non-standard distribution format. Looking at the data, most older people tend to buy more expensive homes, where the data is distributed at the end of the dependent variable, which shows high values. When the curve for such a particular case is drawn to represent such, it will positively skew. The analysis shows that there is a high central tendency as most people can easily make purchase decisions of homes that are not cheap or too much expansive.
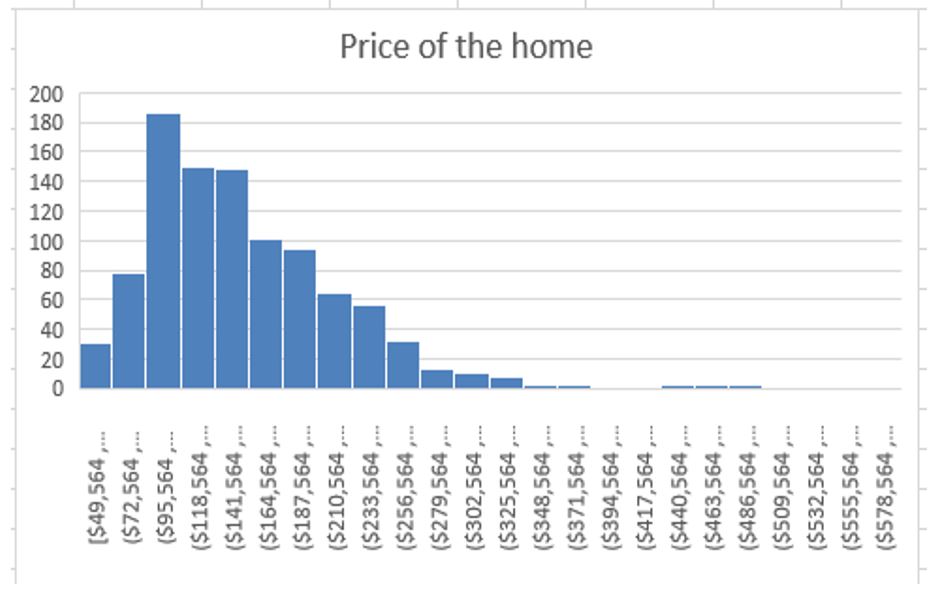
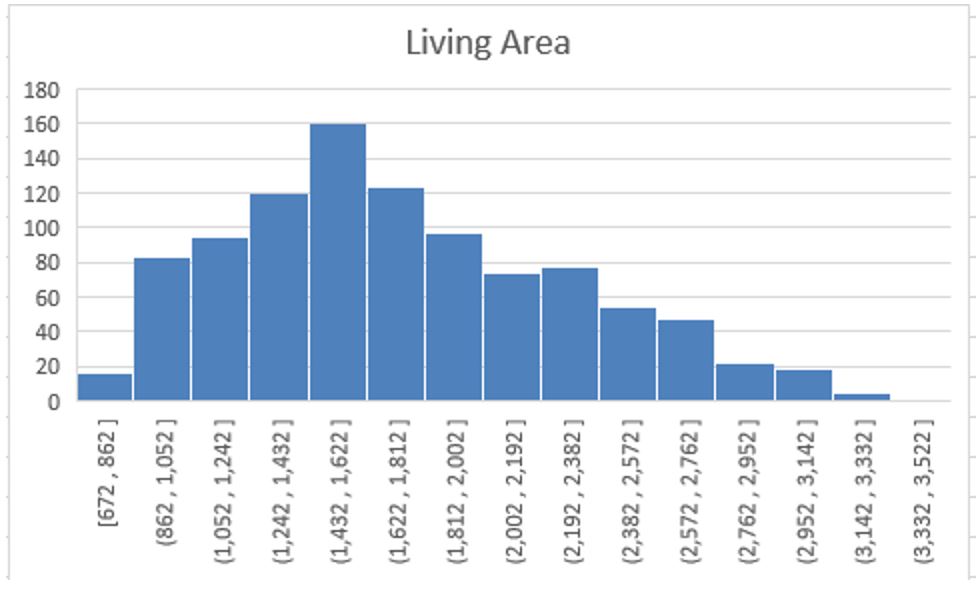
More findings are presented in the frequency histograms, which show the actual outlay of the findings from the research. This is as shown in the histograms below;


From the histogram, which shows the price of a home, it is clear that the one that is averagely priced has more purchases than any other. Most the homeowners are likely to own houses when they are valued at $95564, which turns out to be one of the most affordable choices. However, others are interested in prices that are more or lesser than the one that is frequently purchased. Also, the living area is another great determinant clearly showing the area that is more likely to be occupied than others. Therefore, from these particular results, it is clear that the dependent variable determines the number, the living area, the age, and the number of bathrooms that individuals will choose. When pricing a home, it is always possible to have a look at the demographics and the surrounding environment. Many other factors could have implications on the dependent variables, such as the prevailing economic conditions of the region, among many other important considerations.
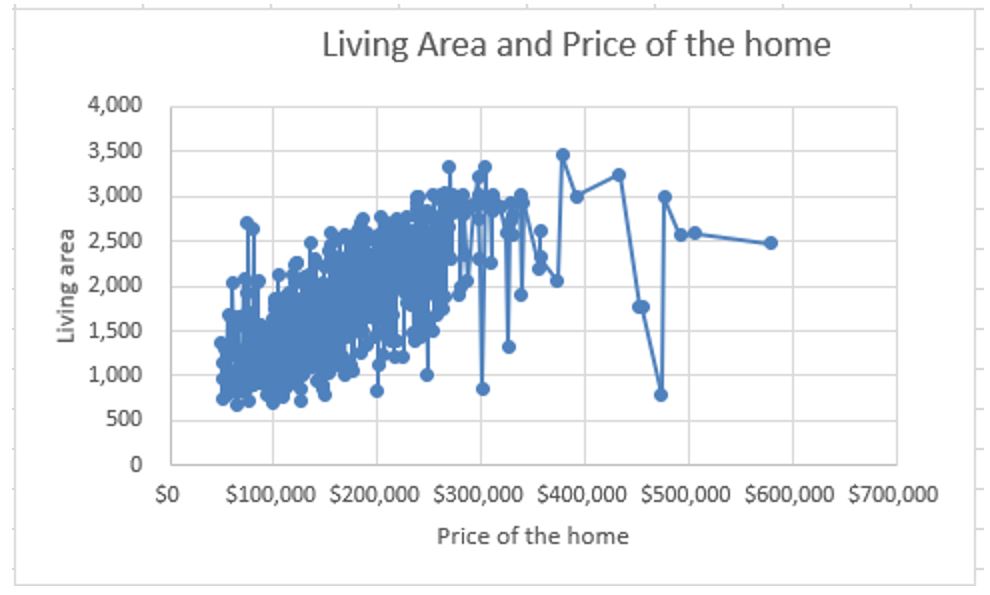
From the scatterplots, it is possible to identify that the variables used in this particular research are non-linear as shown below;

It is a clear indicator that individuals will always have different tastes and preferences when choosing the type of home to own. The price of the home is the independent variable, but looking at it, it does not linearly depend on the other dependent variables that were obtained. The plots that were extracted, show scattered as well as distributed findings, which means that there are variations in how the variables relate to each other in the case. Being a non-linear relationship between such variables, it shows that the direction is both negative and positive. The variables do not just face one direction, but they move in all the directions, and at some point, they are concentrated in one region, which indicates that most individuals prefer the price set at a particular point. Such determinants may be favorable living neighborhood, and the number of rooms and bathrooms, among others.
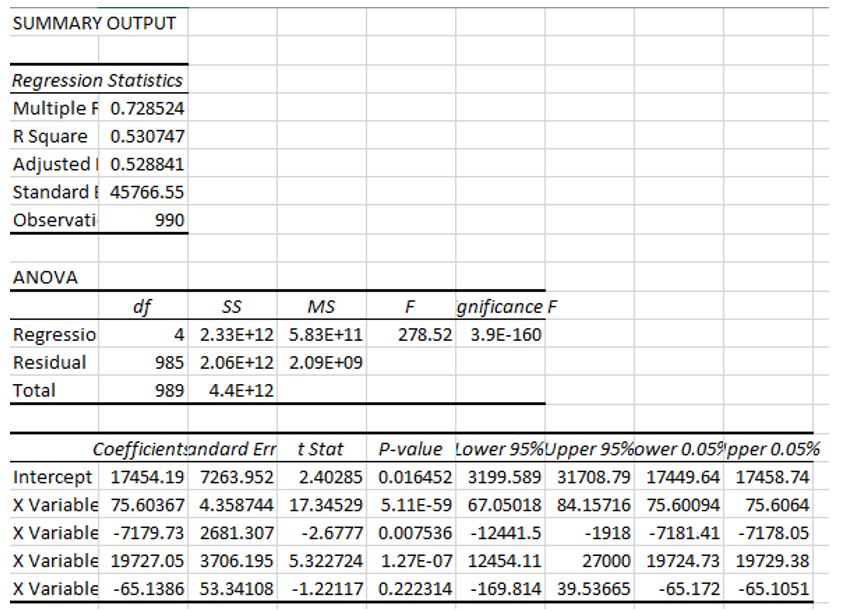
To increase the accuracy and how the independent variable will influence decision-making among the homeowners, a regression model and correlation were carried out as shown below.


This is to prove whether the independent variable, price, played a crucial role in the home. A total of four models were done, and from the analysis, it was indicated that the model living area was the best predictor of the price of a home. From the data analysis presented, it is clear that the living area showed positive results, which means that it can immensely impact the making of decisions among individuals. It is a great determinant of the price, and most individuals would definitely base on it to make the various related decisions. The model also proves that price remains an independent variable and can only change by the area and other determinants that could possibly be used to define it. The living area is the model that is the best fitting in this particular case, while the poorest fitting model is the one of age. Having enough capital to look for a home does not depend on age, or making important decisions for homeownership is independent of age, meaning that anyone who is ready can still have the opportunity to get one.
The multiple regression model is important to increase the accuracy of the results that were obtained in this particular section. The best model that fits in the determinant of the price of a home is the living area. It plays an important role in the setting of the price, which is revealed from the high values that are obtained from the calculations above. Age remains to be a variable that does not have a contribution to the determination of the price of a home. Age has negative findings, and it has been found from this data that various ages have been seen in both the highest-priced homes and others that seem to be cheap. The multiple regression now gives a wider picture as compared to the simple regression. The multiple regression breaks down the variables into their individual constituents and analyzes them, giving out what kind of variable is more fitting to a situation. It further helps us in understanding the important concepts that can determine the prices of a home, hence giving it consideration.
To conclude, statistical data must always be interpreted using various models that will help in gaining insightful context. When having a statistical task, it is always crucial to identify both the dependent and independent variables for easy analysis. Various models of analyzing data include descriptive statistics methods, correlation, and regression, among others. From the data provided, it is clear that price is the independent variable, which is impacted by other factors such as the living area, age, number of bedrooms, and number of bathrooms. The whole data has been analyzed, and the method that has given appealing results is the multiple regression analysis. This is because it is associated with handling each variable independently and assisting in making the final decision. Other variables that may have implications on the price are the economic conditions and the neighborhoods, among others.