Introduction
The purpose of this report is to use statistical tools that allow for regression analysis between quantitative variables. Specifically, the topic of study is the potential impact of the square footage of housing in the United States on the listing price for which a given property sells. A linear regression analysis, a test that applies linear rules to a data set to determine whether a given model is appropriate, can be used to answer the question.
Ideally, the data in the scatter plot presents a clear trend toward linearity, with no distinction, whether it is downward or upward. A measure of the reliability of using a given model is the coefficient of determination, which determines the percentage of the variance of the dependent variable in terms of the independent variable: the higher this number, the better the reliability of the regression (Bloomenthal, 2021). Finally, in a simple regression analysis with two factors, there are two types of variables: independent and dependent. The independent variable is the floor area of the dwelling, which is a quantitative factor that is easily manipulated. In contrast, the dependent variable, or response, is the listing price, as it responds to changes in floor area and increases or decreases. This report aims to perform a simple linear regression analysis to determine the nature of this relationship and the reliability of the linear model.
Data Collection
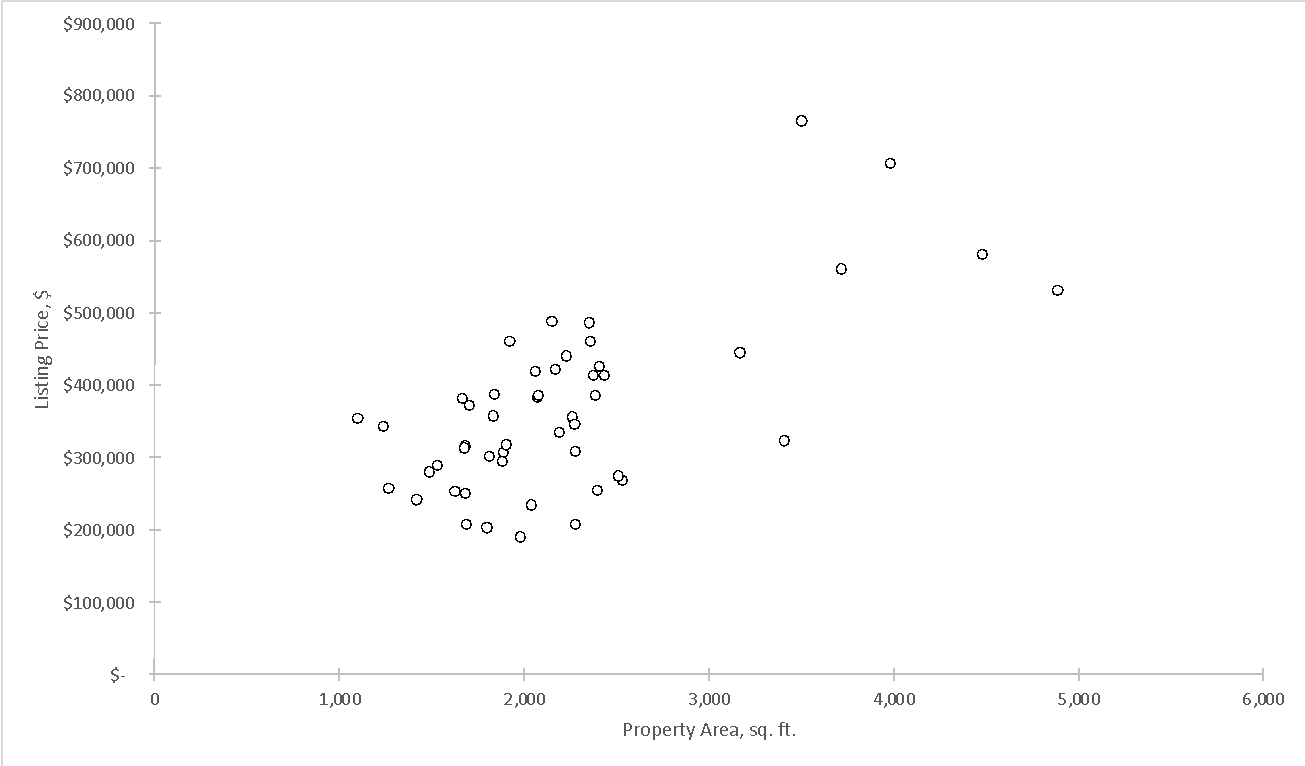
The Real Estate Data Spreadsheet document contains thousands of U.S. home records for different regions, with listing values and square footage of the property. In reality, using such a large group may seem redundant, so forming a random sample is the right strategy for collecting the data (Hayes, 2022). Using =RAND() in MS EXCEL, a random numeric value was assigned to each row, and then the rows were sorted in ascending order. Only the first fifty values were taken for sampling, which means that we can conclude that this group was formed by the mechanism of simple random sampling, in which each of the rows had a chance to fall into the final representative sample. Figure 1 shows a scatter plot for the sample; it can be seen that the linear model does not perfectly describe the behavior of the distribution; however, some upward linear trends can be seen.

Data Analysis
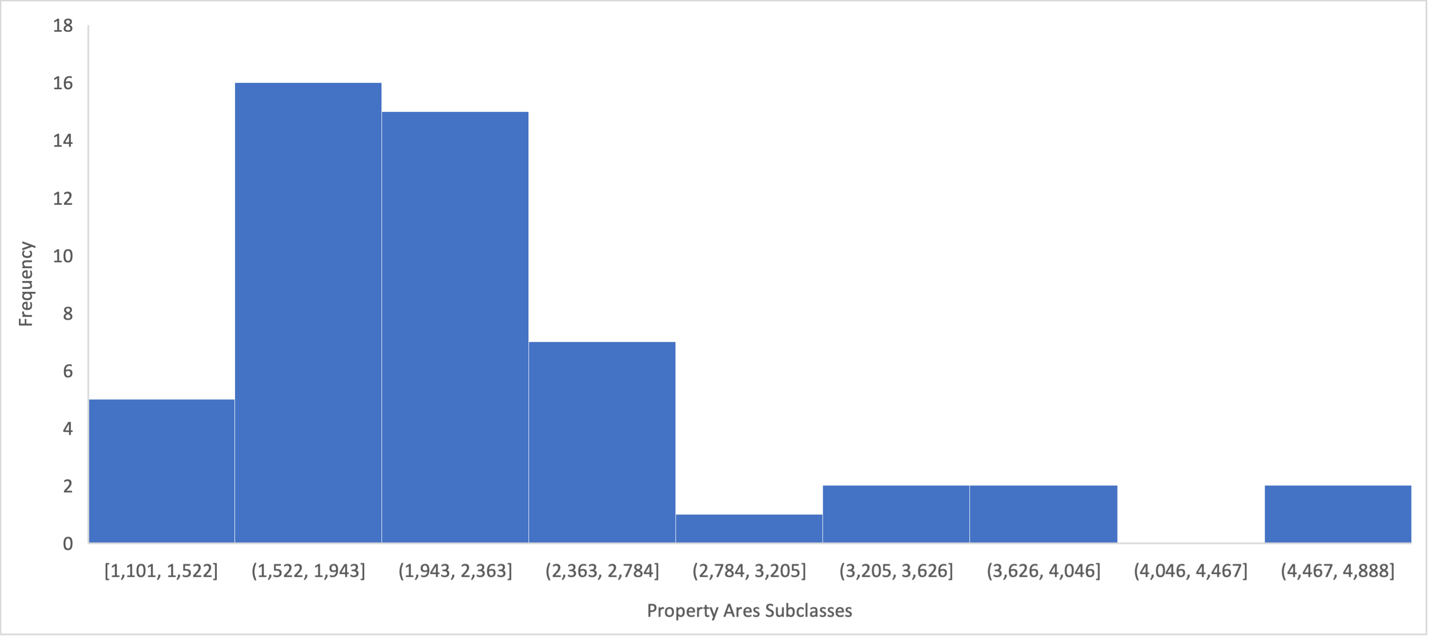
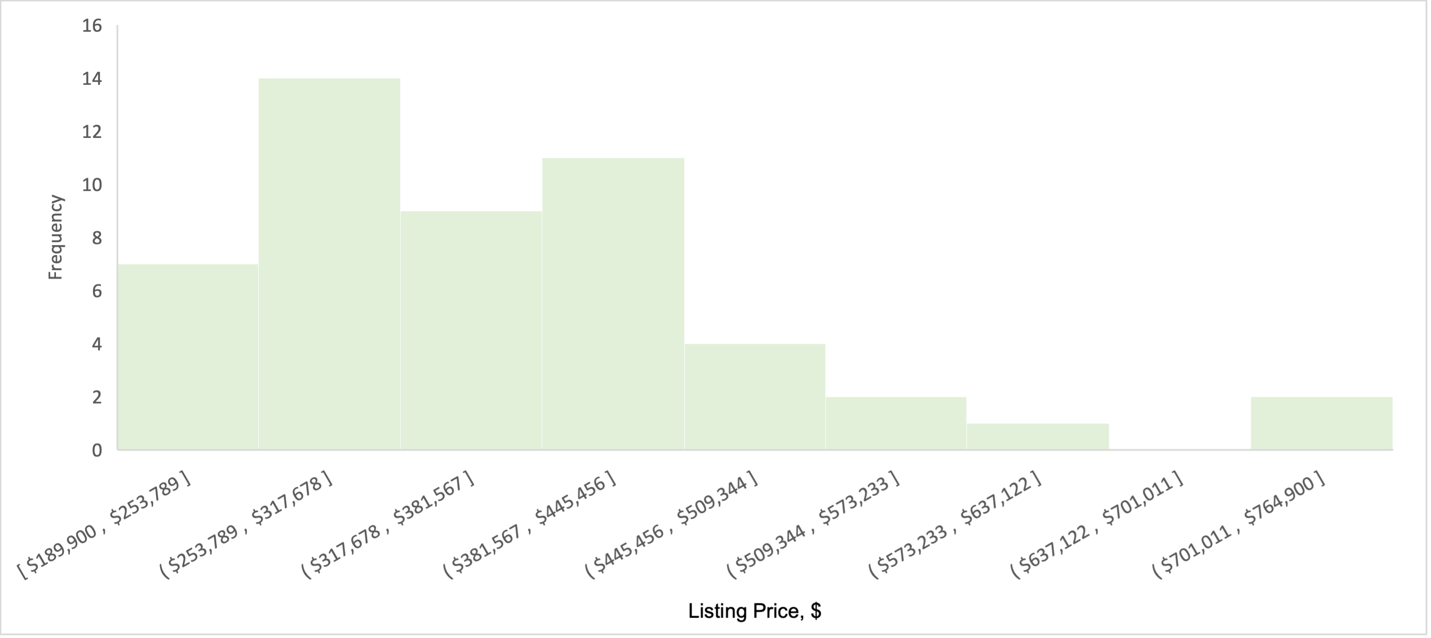
From the data available, a histogram can be plotted for each variable to visualize the behavior of the data in the distribution. Figure 2 shows the histogram for property area in terms of square feet. It can clearly be seen that most of the data are concentrated on the left side, meaning that most of the homes in the sample were no more significant than 2,784 square feet, although there were rooms with much larger areas (outliers). Figure 3 shows the histogram for the listing price per room. one can clearly see that the shape of this distribution is almost identical to the shape of the previous histogram. In other words, the listing price of a larger share of U.S. housing was also concentrated on the left side and thus did not exceed $445,456. For both histograms, discontinuities were noticed with respect to almost the most significant area and listing price, meaning that data from these subclasses were not represented in the sample. There is also a noticeable pattern to the considerable listing price (outlier) reflected in the rightmost part as well. This data alone may hint at linearity in the relationship between the variables, but it requires further clarification.


Descriptive statistics were also used for the two distributions to draw primary inferences about each of the variables in the sample. This data shows that the mean listing price is $366,198 (SD = $120,408), with a median value of $350,550. For square footage, the average was $2,232 (SD = $783), with a median value of $2,074. It is noteworthy that the findings differ slightly from the national data. For example, the mean and median for the listing price was lower (M = $342,365, Median = 318,000), although other characteristics (SD = 125,914) were lower. In contrast, the mean (M = 2,111) of the national characteristics for areas was lower, although other characteristics were higher (SD = 921, Median = 1,881).
Table 1: Descriptive statistics for each of the variables
Regression Model
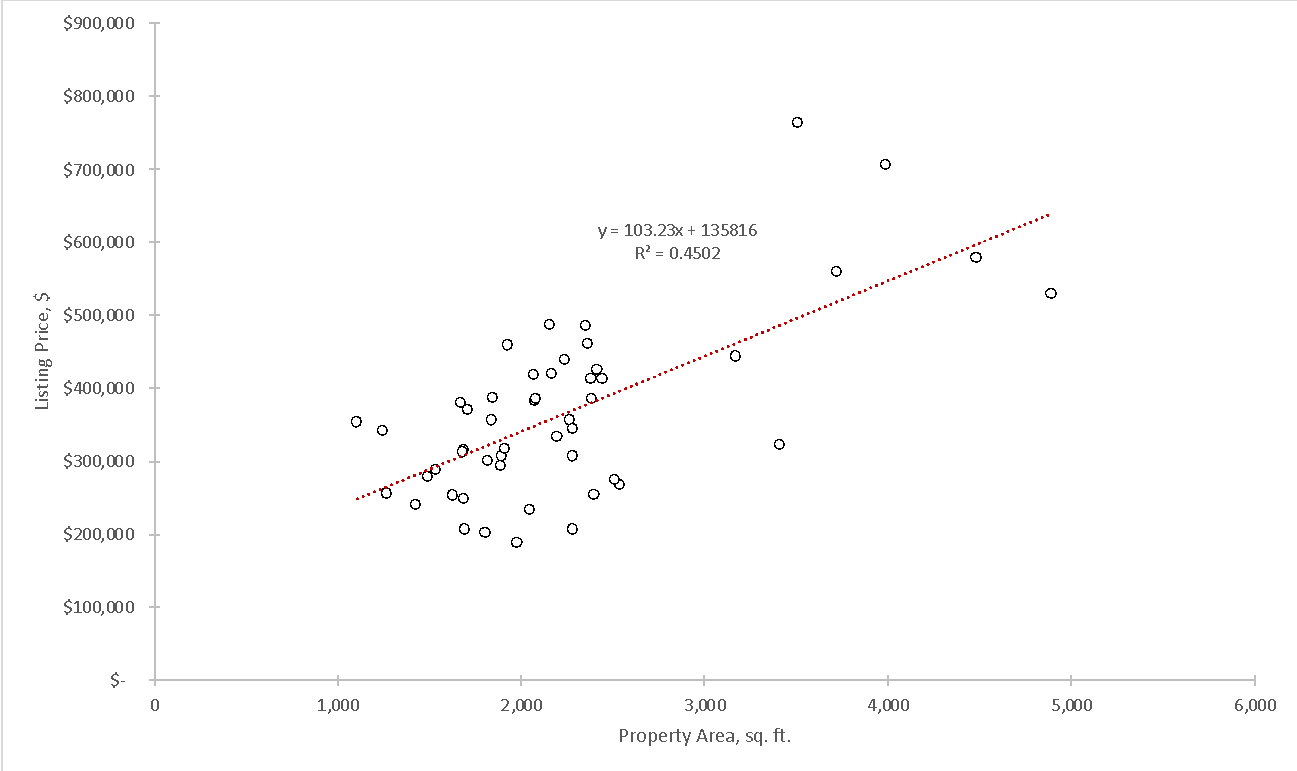
Figure 4 shows a linear regression plot for the sample data set. The measure of reliability, in this case, is the coefficient of determination, which is.4502. In other words, up to 45.02% of the variance of the listing price in this set is explained by this model (Bloomenthal, 2021). For ideal conditions, this may be a low measure of reliability, but for real data, such a small coefficient is acceptable due to the large variability in real distributions (Ballard, 2019). In other words, it can be postulated that the linear trend is fairly dependable for this pair of data. Removing the two rows with extreme values that are outliers according to the boxplot lowered the R2 to.3558, which means the maximum listing values should have been preserved. For a pair of variables, the calculated Pearson correlation coefficient was.671, indicating a moderate positive relationship between the variables. In other words, the results showed that the variables are related, although this relationship can hardly be called intense.

From Figure 4, it can be determined the regression equation for the pair of variables: Listing Price = 103.23 (Area)+135,816. That is, for each square foot increase in area, the Listing Price naturally increases by $103.23; that is, the slope shows the cost per square foot. Notably, the y-intercept does not make sense in this case because it indicates a non-zero value of zero property square footage. The equation can be used to predict listing costs based on the square footage of the room. For example, for a 2,000 square foot space, Listing Price = 103.23(2,000) + 135,816 = $342,276. One can use this equation the other way as well and predict the expected floor area based on the Listing Price.
Conclusions
This paper examined the use of linear regression to evaluate the relationship between listing price and room area. It was found that the relationship between the data in the sample distribution is moderately positive and can be considered dependable. From the data, it appears that there was an increase in listing price when the area of the property increased, which was the expected result. What was unexpected was that removing the outliers determined by the boxplot did not result in an increase in the coefficient of determination but rather the opposite. There is a possibility that increasing the sample size may affect the increase in accuracy of the regression models, but the overall upward trend is expected to remain unchanged. For future work, it is legitimate to examine the trend aspects for specific regions and conduct parametric analyses to determine the differences between them.
References
Ballard, C. (2019). An ode to r-squared. TDS. Web.
Bloomenthal, A. (2021). Coefficient of determination. Investopedia. Web.
Hayes, A. (2022). Simple random sampling: 6 basic steps with examples. Investopedia. Web.