General Summary of Entire Us Demography as Compared With That of Zip Code 60614
The literacy profile of the entire nation differs from that one of zip in that many people in zip have reached bachelor’s degree and graduate level, while the majority of the entire nation is high school graduates and many have gone to some college but have no degree.
The marital status of the population in both populations varied. In USA entirely, majority had ‘now married’ status (51.13%) while in Zip, the majority had ‘never married’ status (54.20%) (Nemiroff, 1995).
Census and ethnic diversity
Races and ethnic communities in the entire nation have been continuously increasing including Americans, Indians, Eskimos, Asians, Blacks, Whites, Hispanic and others. In contrast, in zip, the population of Hispanic and ethnicities in the category of others has been decreasing since 1980 to the year 2000, while the American, Indian, Eskimos and Asian populations, though reduced between 1980 and 1990, have been on the increase between 1990 to 2000 (Sandefur,1996).
Residential houses occupied
Rental houses were decreasingly being occupied as the majority of the population increasingly owned their own houses in zip territory. This contrasts the entire US population trend that has been observed going for both rental and fully owned houses at an increasing rate (ESRI Press, 2004).
Population in the labor force
The population rate of those not in the labor force in zip is less compared to the rate of the entire country (The University of Michigan, 1994). Majority of the population in the entire nation is employed in manufacturing, health and retail trade industries while that of zip is employed in professional scientific and technical service and financial and insurance industry (Nemiroff, 1995).
Income
- The per capita income of zip territory was higher than that of the entire nation.
- The majority of the population in zip earns an income of $25,000 or above (each) while that of the entire nation ranges on $1-$2,499 and $25,000-$34,999 (Denton, 2005).
- Also, the majority of people between the age of 25 to 44 earns an income range of $100,000-$124,999 in zip and $75,000-$99,999 in the entire nation (Wansink, & Sandman, 2002).
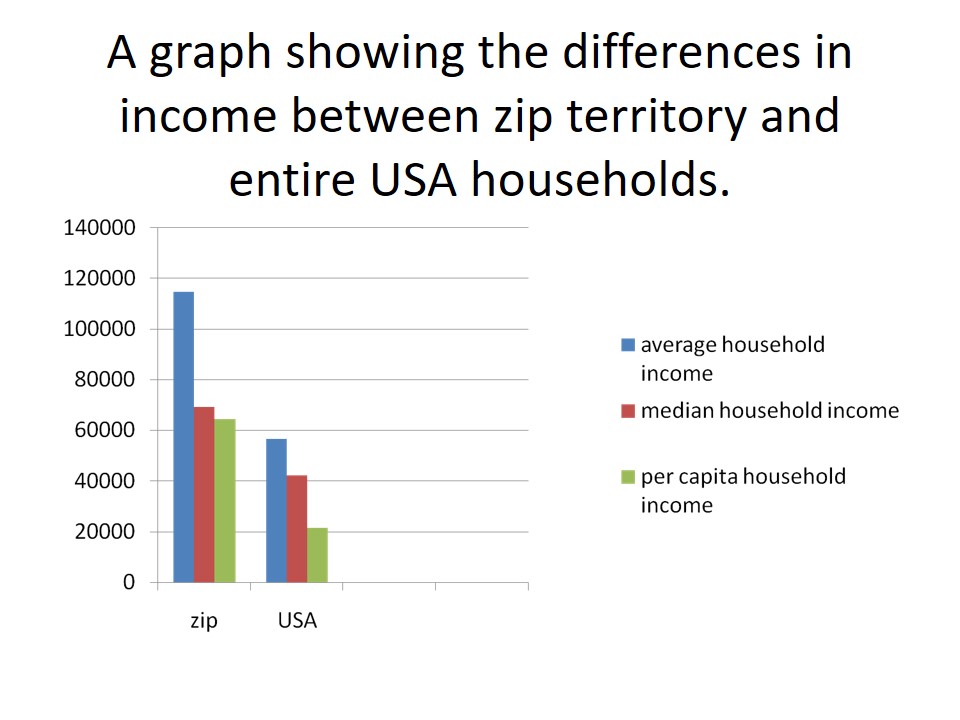
It can be seen from the graph presentation that the various household income of zip territory is far much higher than that one of the entire nation.
The per capita house income in zip territory is 64426 while that one of entire nation is 21587.
Questions
- Considering the differences found in the two areas in comparison, should the firm consider segmentation of marketing activities?
- What causes the fluctuation of the population numbers of zip territory ethnicity and what effect does it have on the firm marketing activities?
- Considering the higher per capita income and the increasing need to own houses in zip territory, is there profitable opportunity exploitable by the firm? (Berger, 2011).
References
- Berger, A. S. (2011). Ads, Fads, and Consumer Culture: Advertising’s Impact on American Character and Society. Lanham: Rowman & Littlefield.
- Denton, R. E. (2005). The 2004 Presidential Campaign: A Communication Perspective. Lanham: Rowman & Littlefield.
- ESRI Press. (2004). Community Sourcebook of ZIP Code Demographics 2004. Redlands, California: ESRI Press.
- Gokhale, J. (2010). Social Security: A Fresh Look at Policy. Chicago: University of Chicago Press.
- Nemiroff, R. (1995). A raisin in the sun: and, The sign in Sidney Burstein’s window. New York: Vintage Books.
- Sandefur, G. D. (1996). Changing Numbers, Changing Needs: American Indian Demography and Public Health. Washington, D.C: National Academies Press.
- The University of Michigan. (1994). Upclose demographic digest 1994: a sourcebook of key demographic statistics for every populated Zip Code included in the 1990 census. Chicago: UPCLOSE Pub.
- Wansink, B., & Sandman, S. (2002).Consumer Panels. California: American Marketing Association.