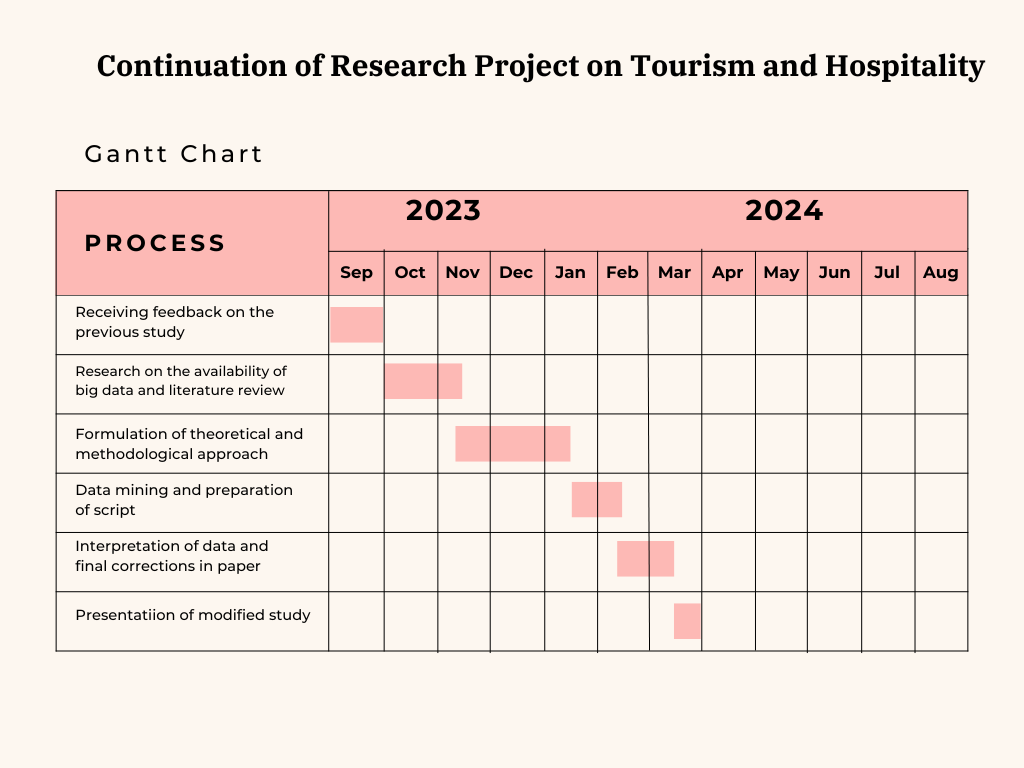
Gantt chart is an effective tool for representing a project schedule for the public. In addition, it may serve as a guideline for a researcher who has some difficulties with planning and time management (Oburu, 2020). The Gantt chart attached in Appendix A presents the approximate schedule for the next study on tourism and hospitality (Table 1). My recently conducted study called “Digital Marketing in Tourism and Hospitality” was based on interviews and surveys with guests about their perception of digital commercials in tourism. The survey results demonstrated people’s positive attitudes toward digital commercials in the tourism industry.
The proposed study uses a more complex methodology by collecting large data samples from social media resources. Although the exact formulation of the topic is a task for further work, it can reveal the main features of Internet users’ perceptions of digital marketing in tourism. This task requires extensive data mining and quantitative preparation, so it is crucial to elaborate on the flow of research. The prepared Gantt chart is a great summary of all the necessary steps during research implementation.
Reference
Oburu, A. O. (2020). Effective project time management. International Academic Journal of Information Sciences and Project Management, 3(6), 47-55. Web.
Appendix A
Table 1. Gantt chart of new study. Created by the author
