In this paper, a statistical analysis was conducted to process two time series containing information on the number of sales over seventy weeks. Strictly speaking, a time series is a set of data indexed by a time variable, so the raw data in this paper were sales distributions for each of the seventy weeks. Two time series were used in the paper: the primary finding may be that sales were significantly different for the two product categories, and Type 2 showed higher values for all seventy weeks. Statistical time series analysis can occur through several strategies, and one such strategy is a regression because, in general, it appears that the data may have exhibited an upward trend.
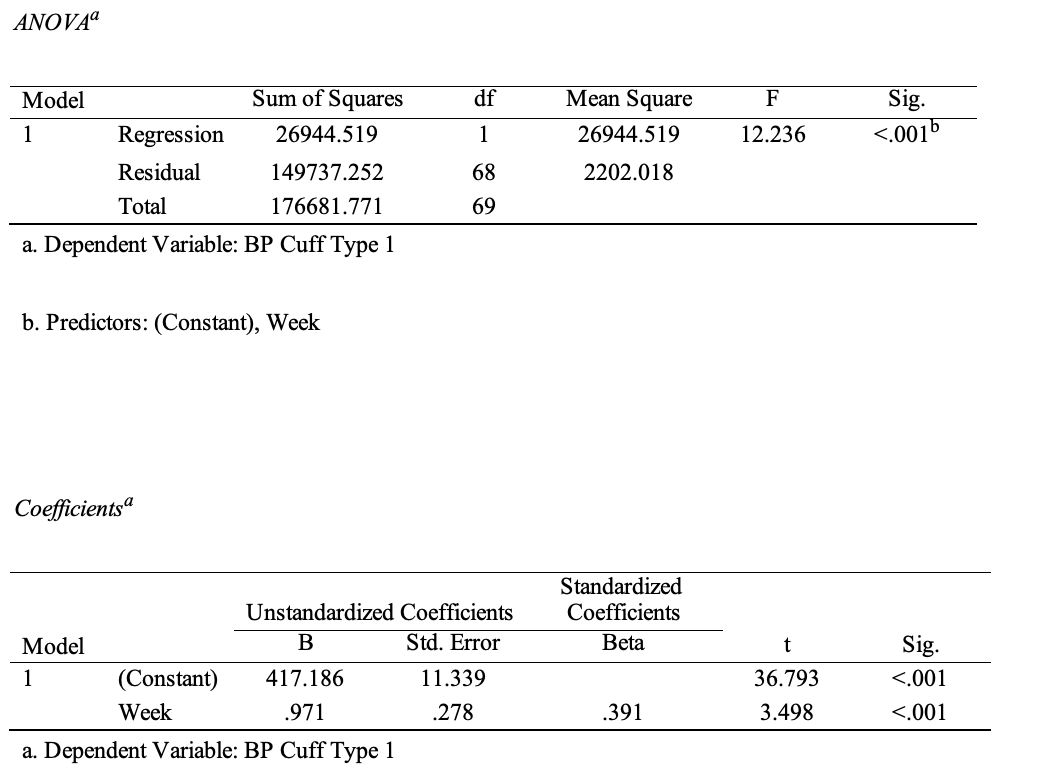
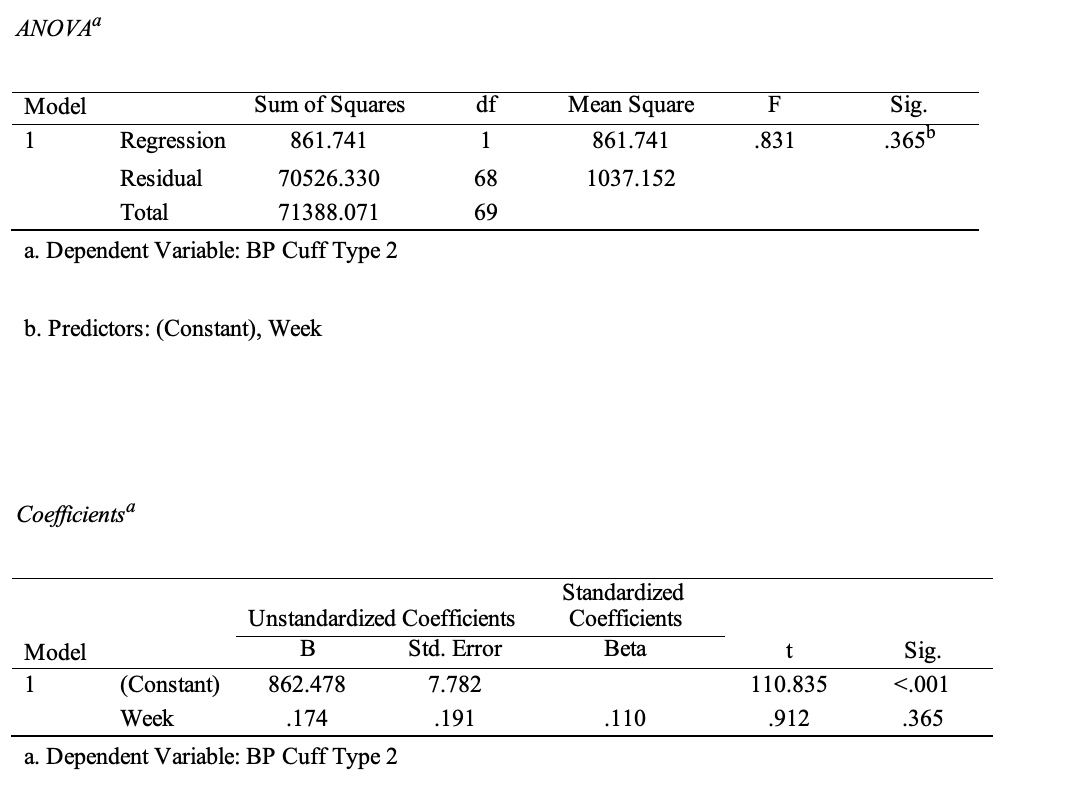
Regression analysis is used to analyze the relationship between two quantitative variables, and it has the advantage of building a model that can be used for forecasting. Table 1 and Table 2 show the results of a simple regression analysis: one can see that only for type 1 cuffs the model is significant (p <.001), and the predicted regression equation is y = 417.186 + 0.971x, which means that over time the number of type 1 cuff sales increases by 0.971 every week. The coefficient of determination for this model is 0.153, which indicates the low reliability of the constructed regression. For type two cuffs (R2 =.012), the results were inconclusive because it is likely that the time distribution did not give any clear upward or downward trends.


It then becomes clear that regression analysis is not effective with respect to the available data because even though it shows a significant relationship between sales over time and an overall upward trend, it does not explain more than 1.2 percent in variance. In this case, it is possible to use the ARIMA (autoregressive integrated moving average) forecasting model, which also allows for the construction of forecast values based on available past sales data (Hayes, 2022). The advantage of ARIMA over simple regression analysis is the ability to work with data that does not show a trend and the combination of integration, autoregressive, and moving average techniques. Table 2 shows the results of the ARIMA test for two time series, where p and q were chosen as one and d was equal to 2, based on a prior autocorrelation study (Verma, 2022).
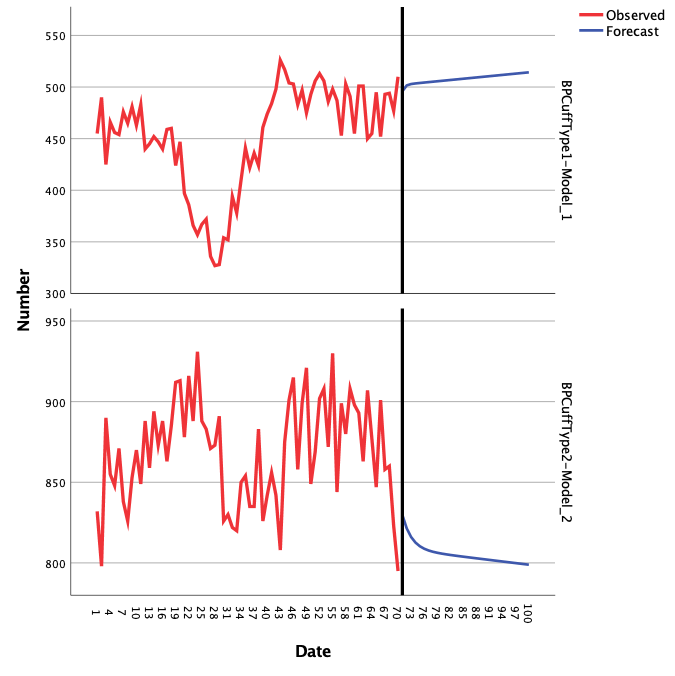
As can be seen from the results, the coefficients of determination for the two cuff types became significantly higher, which means that the constructed models better describe the variance in the two distributions. Figure 1 shows the prediction plots for sales of the two types of cuffs. As can be seen from the graph, sales of the second type of cuffs are predicted to increase over time, but the opposite trend is characteristic of the second type of cuff.


In general, two different methods of analysis were used to analyze the two time series, namely simple regression and ARIMA. Each method of analysis was based on the use of past sales data, so it was extrapolative. At the same time, the reliability of the ARIMA method turned out to be higher, not only because the model works with temporal data without seasonal trends but also because of higher values of the coefficient of determination. In particular, the maximum precision for the regression analysis was R2 =.153, whereas, for ARIMA, this value rose to R2 =.803.
It is important to recognize that although both products sold are cuffs and serve the same application function, they differ in terms of pricing. Cuffs of the second type have a much higher cost and thus may be aimed at the more solvent consumer who is willing to pay more for a product that can be purchased more cheaply. It is for this reason to predict the sales of one type of cuff using data on past sales of the other does not seem appropriate. It is certainly technically possible, but the accuracy and reliability of such forecasting seem questionable. Finally, to determine whether both types of cuffs are substitute or complementary, one must look closely at the data.
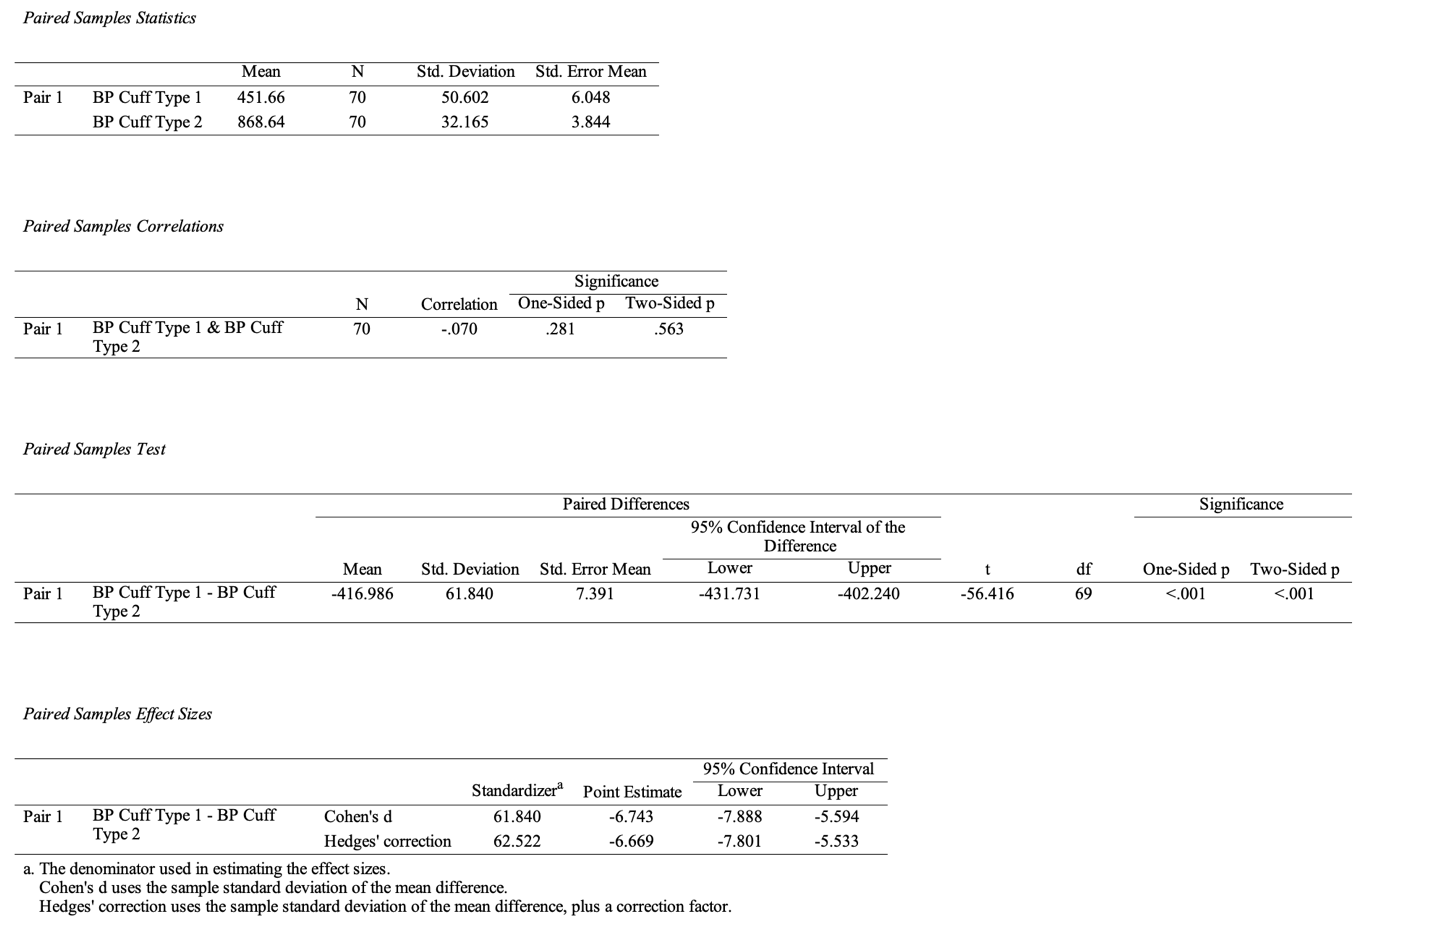
One statistical method for determining the relationship between the two cuff types is the paired sample t-test, which determines whether differences in means between distributions are significant (KSU, 2022). As Table 4 shows, the data show a weak negative correlation (r = -.70), and the significance of the differences is below the critical level (p <.001). Given that the average sales value for type 2 cuffs is nearly twice as high as for type 1 cuffs, this may indicate that the products are not substitutes, as the differences between them are significant.

References
Hayes, A. (2022). ARIMA model: Autoregressive integrated moving average. Investopedia. Web.
KSU. (2022). SPSS tutorials: Paired samples t test. Kent State University. Web.
Verma, Y. (2022). Quick way to find p, d and q values for ARIMA. AIM. Web.