Description of the economic indicator
Employment pattern in the automotive industry of Indiana is an economic indicator that provides details about the distribution of workers county by county. In the Indiana automotive industry, employment is categorized into two: The employees working on vehicle parts and those working on complete vehicles.
In 2008, the automotive industry employed 58% people in companies that manufacture vehicle component. Approximately 29.6% of the workers in the industry manufactured frames of vehicles were employed. The companies manufacturing complete vehicles employed 12,720 people, which is about 12.4%.
A research conducted to establish the employment rates of the automotive companies in Indiana from 1998 to 2008 indicated that Cummins offers employment to the largest number of people in Indiana. Other companies in Indian are Firestone Diversified Products, Remy International Inc. as well as Remy Inc. These companies build automotive parts, and were regarded to provide the highest number of employment in Indiana.
On the other hand, companies such as Toyota Motor Manufacturing and Subaru; were found to be the only companies manufacturing complete vehicles in Indiana. The data collected shows that the companies building vehicle components employed more people than the companies manufacturing complete vehicles (Thompson & Merchant, 2012).
In Indiana, the automotive industry offers employment to people across the region. However, the north eastern section of the region has been dominated by automotive companies. It was established that, people in 12 counties had not been employed in the automotive industry, out of the 92 counties. People from most of the counties were employed in manufacturing automotive parts. It was only in six counties where more than a thousand people were employed in manufacturing complete vehicles (Thompson & Merchant, 2012).
Graphic description of the economic indicator
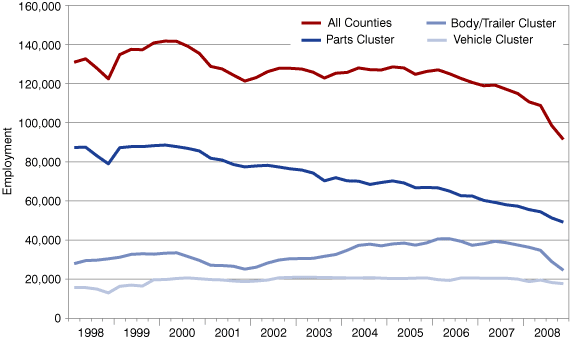
The figure below shows the employment patterns in the automotive industry from 1998 to 2008. From the graph, it is evident that the rate of employment declined from 1998 to 2008. In all counties, fewer people were employed in the automotive industry each subsequent year. The red curve shows a decline in the employment rate in all counties. It is also evident that companies manufacturing parts of vehicles offered the highest number of employees.
The parts cluster is recorded to be above all the other three curves. It is noteworthy to mention that parts cluster declined in 1998 to 2008. Therefore, the companies manufacturing automotive parts had a declining trend in the employment rates. The body/trailer cluster was the second last in the number of employees getting jobs in the subsector. However, this subsector indicated a positive growth in the rate of employment from 1998 to 2008.
In 2007, this subsector had the highest rate of employment compared to the other years. The trend declined in 2008. Lastly, the vehicle cluster had the least number of people employed for the period from 1998 to 2008. The complete vehicle subsector had a stagnant rate of employment. This means that there was neither a decline nor an increase in the employment rate in the subsector (Thompson & Merchant, 2012).

Source: Thompson & Merchant (2012).
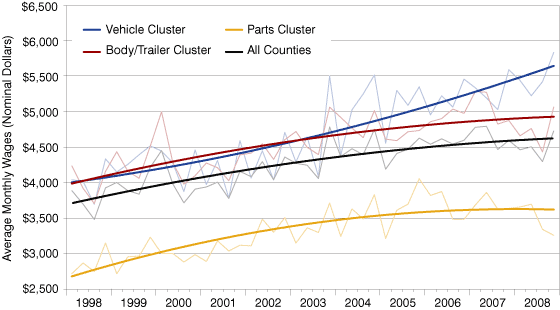
It is also important to mention that the wage rates increased slowly for employees in all the subsectors for the period from 1998 to 2008. The parts cluster had the lowest wage rates, while the vehicle cluster had the highest wage rates. The body/trailer cluster had relatively high wage rates in the beginning, but the wage rates declined from 2003 towards 2008. An increasing trend in the wage rates was recorded in all the counties in Indiana (Thompson & Merchant, 2012).

Source: Thompson & Merchant (2012).
The agency/organization that compiles the indicator
The Indiana Business Research Center (IBRC) conducted the research and compiled the data. The IBRC was founded in 1925, with the mandate to conduct research at the Kelly School of Business, Indiana University. The center gives information concerning economic variables to businesses, government units and non-profit organizations in Indiana.
The IBRC maintains a strong database for information concerning the performance of various economic variables. Original research is conducted to develop data that are reliable (Indiana Business Research Center, 2012).
The timeframe the indicator is released/ published
The Indiana Business Research Center conducts research on a monthly basis. This strategy is aimed at providing up-to-date information about economic variables. The rate of employment in the automotive industry is one of the economic indicators, which are published on a monthly basis.
As such, the IBRC provides information that is relevant to the actual scenario in the region. Therefore, the data collected, and the findings of IBRC are reliable. The information provided by IBRC is reliable, and can be used to identify changes in the automotive employment economic indicator.
The overall (macroeconomic) relevance of the indicator and relevance for workforce development (microeconomic)
The automotive industry employment economic indicator has a macroeconomic relevance, in that it shows how the automotive promotes the income levels of the people in Indiana. The automotive industry has contributed to the development of the Indiana economy. It also creates employment to a large number of workforces in the region.
Therefore, by providing employment to a large number of people in the region, the economic indicator shows that the living standards of the people have been promoted. Employment in the automotive industry in Indiana has a lot of relevance on the growth of GDP of the economy. Therefore, the economic indicator will help the government in making appropriate decisions of improving the performance of the industry.
It is evident that the automotive industry provides a lot of employment to the people in the region. It has also been established that the rate of unemployment has been declining from 1998 to 2008.
This shows that there is the need to intervene in the industry to ensure that many people are employed, and that the growth in employment rate is maintained to sustain the employees in the industry. In addition, it is notable that the wage rates have been increasing. This is a clear sign that the people employed in the industry are benefiting from the increasing incomes over the years (Hughes & Cain, 2011).
The microeconomic relevance of the automotive employment economic indicator is that, the government should adjust the training and education programs. Since the automotive industry offers employment to a large people in the parts subsector, the institutions that offer education and training should focus on educating people on how to manufacture automobile parts.
A lot of emphasis should be placed on the parts manufacturing because many people can be employed in this subsector. On the other hand, the complete vehicle subsector should not be ignored. However, only a few people should be trained to serve in the complete vehicle subsector.
This will help promote the complete vehicle manufacturing, while avoiding a scenario whereby there are many people with skills, but they remain unemployed. These strategies will help the government to promote the level of employment in Indiana. As such, the income levels and the living standards of the people in the region will be promoted (Stiglitz & Walsh, 2006).
References
Hughes, J. R. T., & Cain, L. P. (2011). American economic history. Boston: Addison-Wesley.
Indiana Business Research Center (2012). History of Indiana Business Research Center. Web.
Stiglitz, J. E., & Walsh, C. E. (2006). Economics. New York, NY [u.a.: Norton].
Thompson, M. F. & Merchant, A. A. (2012). Segmenting Indiana’s Automotive Manufacturing Industry: Jobs and Wages. Web.