Introduction
Perceptual memory is based on automation and categorization operations to optimize routine processes. The human brain is designed to automate constantly repeated calculations over time to conserve the energy of cognitive resources — this uses schema, patterns of perceptual reality that help the brain quickly recognize the phenomenon (Baddeley, 1990). Schema finds their relevance in processes that turn out to be systematic because the individual encounters them regularly, and the brain does not need to expend resources to process incoming signals. However, it is fair to admit that schemas are often distorted or incomplete substitutes for real-world phenomena.
The present study aims to explore the mechanisms of perceptual memory through such schemata. The motivation for the experiment is a seminal study by French & Richards (1993), who found that cognitive schemata were more likely to lead to perceptual errors than copying techniques. Precisely, test respondents in three strategies for interacting with a dual must sketch its image; the interest is to determine precisely how respondents completed the number IV (IIII). The study assumes that respondents are likelier to refer to ready-made cognitive diagrams to process such routine information because it is easier to perceive than the actual image, so they tend to make perceptual errors. In the context of the study, the hypothesis is that the memorization strategy leads to a higher frequency of number IV (IIII) sketching errors than the copying strategy.
Method
Design
The present study was based on a quantitative experimental paradigm involving the random assignment of individuals to groups. Awareness was used as the independent variable and was offered to respondents when they performed. Specifically, participants were told that they should either look at the dial, look at the dial and draw it, or look at the dial and draw it without the picture disappearing. Thus, the manipulation of the independent variable included the degree of information given to respondents before the test. In turn, the study’s dependent variable was the outcome, defined as whether the dial pattern was correctly drawn or incorrectly remembered. Specifically, on the dial, the numeral four was represented as “IIII” instead of “IV,” which is typical for mechanical watches but atypical for other uses of this Roman numeral. Thus, the respondent could sketch the dial diagram correctly or incorrectly, depending on the amount of information they were given before the test.
Participants
The sample comprised 72 respondents, most of whom (79.2%, n = 57) were female, and the remainder (20.8%, n = 15) identified as male. In the context of the age distribution, the mean age of the sample was 29.44 (SD = 9.59), but this result may have been inaccurate due to one respondent marking his age as zero. However, when this line was removed, the mean age increased slightly and reached 29.86 (SD = 8.99), so it can be postulated that the mean age of the sample ranged from 29 to 30. The trial was conducted on November 24, 2021, when respondents were randomly assigned to test groups: thus, Surprise included 25 respondents, Forewarned included 23 respondents, and 24 individuals represented the Copy group.
Incentives
The intervention was implemented at three levels depending on the information the individuals received. In the Surprise group, individuals were unaware that they would have to draw a dial; in the Forewarned group, they were aware but were limited in time to remember; finally, in the Copy group, there were no limitations in time or degree of awareness.
Procedure
Participants from the Surprise and Forewarned groups were given one minute to study the dial pattern, after which they had five minutes to answer whether they noticed anything strange in the image and reproduce the dial pattern. Special attention — respondents were unaware of this — was given to the number IV (IIII) because participants could sketch it either correctly (IIII) or incorrectly (IV). The procedural difference between the two groups was communicated to respondents before the demonstration. For the Copy group, participants were given five minutes with the image being kept on display to try to copy it onto a piece of paper, after which they were also asked if they noticed anything strange. The data were collected in a spreadsheet and then analyzed using SPSS in the context of the Chi-Square Association Test.
Table 1 — Number of respondents in each of the intervention strategies.
Results
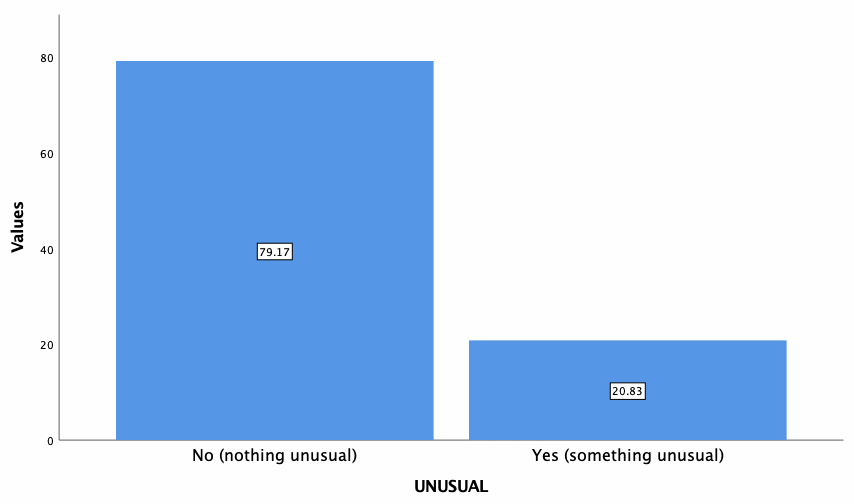
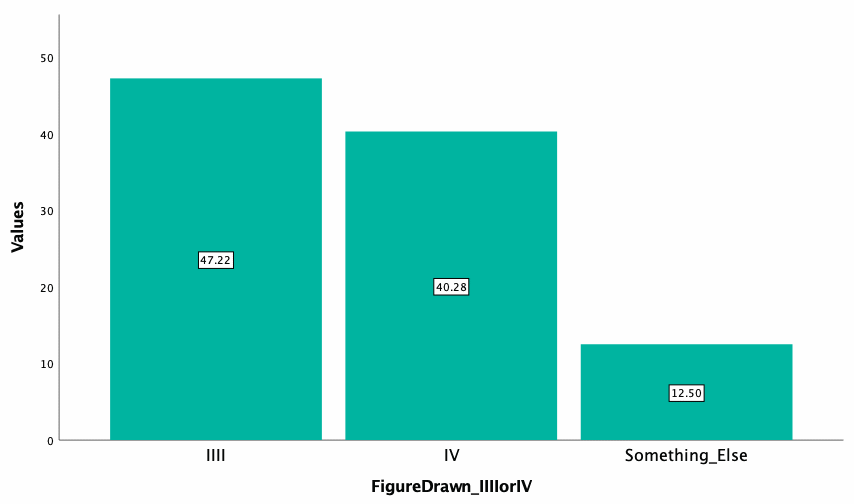
Table 1 shows the frequency distribution of participants within each group, and Figure 1 reports that 79.2% of respondents did not see anything unusual in the dial. As shown in Figure 2, the majority of respondents (47.2%, n = 34) saw the correct number IIII on the dial, while 38 individuals made an error by indicating IV (40.3%, n = 29) or something else (12.5%, n = 9).


Cross Table 2 shows that respondents in the Copy group were most likely to see something unusual in the dial, while participants in the Surprise group were most likely not to see anything unusual. However, inferential statistics show that the separation was not statistically significant, as χ2(2) = 2.205, p =.332 (Appendix A). Cross Table 3 describes that respondents in the Copy group were most likely to answer correctly (IIII), with the Surprise group having the highest percentage of errors. The Chi-square of the Association Test shows that χ2(4) = 8.929, p =.063, meaning that even in this case, the choice of response was not statistically related to the type of intervention.
Table 2 — Cross-distribution of trends among the sample (Normal vs Unusual).
Table 3 — Cross-sectional distribution of trends among the sample (IIII vs. IV).
Discussion
The results demonstrated that each intervention group equally selected correct and incorrect answers. In other words, pre-test information proficiency was not related to correct judgments, and an intentional restriction in respondents’ knowledge did not lead to the expected results. This means that the study’s hypothesis cannot be confirmed because it was found that the use or non-use of cognitive schemata did not lead to meaningful differences in the accuracy of the results.
Notably, the results are inconsistent with French & Richards (1993) and show diametrically opposite outcomes. This may be due to additional influencing factors not anticipated in this paper, which could have led to distortions since the procedural part of the test replicates the fundamental study. In French & Richards, a large portion of the sample was under 18 years of age, which was not the case in this work, which could have affected the results. Another limitation, besides accounting for additional variables, is the lack of control over the use of the electronic testing device, as it is likely that this condition also influenced the outcome. Consequently, further research in this area should focus on expanding the variables included and accounting for confounding factors.
The study examined the effect of cognitive schemas on the likelihood of respondents making errors in a dial experiment. The assumption that using cognitive schemas leads to an increase in perceptual errors was not confirmed, and the study contradicted the original results. Consequently, it was assumed that there were confounding variables unaccounted for in the work that influenced the distortion of the results, the study of which is part of further practice.
References
Baddeley, A. (1990). Human memory: Theory and practice. Lawrence Erlbaum.
French, C. C., & Richards, A. (1993). Clock* this: An everyday example of a schema‐driven error in memory.British Journal of Psychology, 84(2), 249-253. Web.