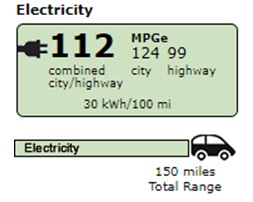
Introduction
The 21st-century society is heavily dependent on road transport and related developmental projects that aim to promote the substantial growth of road transport. Moreover, there is the forecasted increase of gasoline and diesel demands among road users. These two before-mentioned features are adversely associated with air quality and climate change; hence they have led to Internal Combustion Engine Vehicles (ICEVs) being slowly replaced by electric vehicles (EVs), a cheaper and more environmentally friendly alternative form (Muneer, Kohle & Doyle 2017). The U.S. and other countries have formulated plans and strategies to facilitate the introduction and adoption of EVs in the market.
Presently, the EV market in the U.S. constitutes of plug-in electric vehicles (PEVs), battery electric vehicles (BEVs) and hybrid electric vehicles (HEVs) (Chau 2016). The BEV utilises a lithium-ion battery and functions on an electric motor; the PHEV runs on a battery but later switches to gas in situations when the battery is low; and the HEV runs on both electricity and gasoline.
The charging of EVs varies with the model type. Electric vehicles can be charged by plugging one end of a charger into a vehicle while the other end is connected to an electrical grid, also known as electric vehicle supply equipment (EVSE).
According to Chau (2016), there are three primary categories of chargers based on the power output of the outlet: level 1 (charging through a 120V AC plug), level 2 (charging through a 240V with additional equipment) and level 3 (charging through 480V with special other equipment).
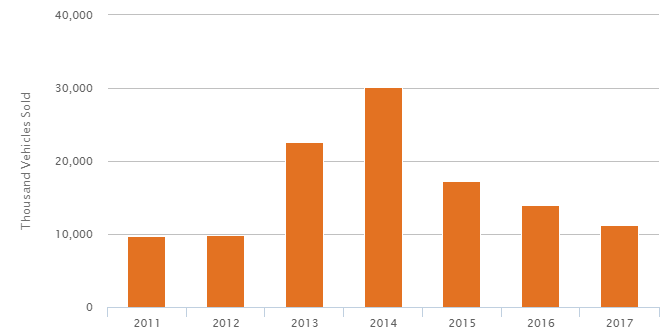
From 2011 to 2014, the BEV has exhibited positive sales; however, since 2015, its sales and growth rate has slowed (see Figure A-1). The reduction in growth is attributed to the limited charging infrastructure and driving range, which are still in their initial stages of development (Schwanen 2019). It is essential to take note of the fact that the BEVs only represent approximately 1% of the total fleets in the U.S. Moreover, the demand of BEVs is profoundly concentrated in specific automotive geographies, for instance, nearly half of all BEVs retailed in the U.S. have been purchased in California (Muneer, Kohle & Doyle 2017).
Moreover, there have been little controversies revolving around the use of BEV vehicles and they include their global warming potential and pedestrian safety. Although the BEV has a zero tailpipe emission rating, it adversely affects the environment in terms of the manufacturing of lithium-ion batteries.
On the other hand, in pedestrian safety, BEVs have relatively low propulsion and rolling noise. This report aimed to compare PEVs and the Internal Combustion Engine Vehicles (ICEVs) based on the economic and environmental indicators for vehicle production and usage.
Methodology
This research focused on comparing electric vehicles to internal combustion engines – an economic evaluation that emphasised on the Total Cost of Ownership, the environmental impact and safety analysis.
Total Cost of Ownership
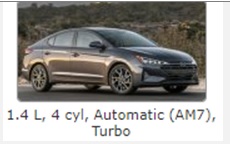
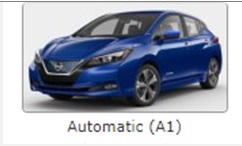
In this study, the Total Cost of Ownership (TCO) model was employed in comparing the cost of ownership between two comparative compact cars in different market segments. The vehicles selected for the study consisted of one BEV (2019 Nissan Leaf) and ICEV (2019 Hyundai Elantra) in an American marketing setting (see Table B-1 for detailed specifications of each vehicle). The U.S. market segment was used as a reference for evaluating prices as it is among the countries with the most significant market volume in the car industry.
TCO is an accounting term referring to the purchase cost of an asset, including the operation cost for a given usage period. Four factors were selected to act as measures for the comparison and they consisted of the purchase cost of the vehicle, maintenance, and service for a 1-year duration, taxes and subsidies, fuel cost for a single year, and the TCO (see Table B-2 for the TCO breakdown). It is essential to note that the energy policy in the U.S. is based on CO2 emissions.
Environmental Impact and Safety
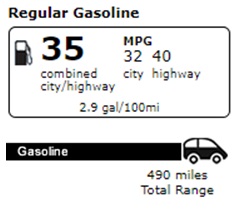
The environmental impact was assessed by focusing on greenhouse gas (GHG) emissions and air pollution (AP) of the two car models. The overall ecological impact values obtained for each car model were aligned to the standards presented by the EPA (see Table B-1). The EPA measured vehicle fuel economy and greenhouse gas emissions using a set of standardised tests Environmental Protection Agency (2019). These tests imitated the typical driving patterns. Moreover, to get the absolute values of AP and GHG emissions of the individual vehicles, the following formulae were used (see Table C-1 for the values of AP and GHG):
For internal combustion engine vehicles
AP = mcarAPm
GHG = mcarGHGm
For electric vehicles;
AP = (mcar − mbat) APm + mbatAPbat
GHG = (mcar − mbat) GHGm + mbat
where mcar and mbat are the masses of the car and battery, respectively; APm and APbat is the air pollution emissions per kg of the conventional vehicles and lithium-ion batteries, respectively; GHGm and GHGbat are the greenhouse gas emissions per kg of ICEVs and lithium-ion batteries, respectively.
Pedestrian Safety
A desk study design was used in which existing empirical and theoretical literature was used to explore and compare the pedestrian safety of BEVs and ICEVs. Relevant literature published from 2011 to recent was searched on various databases. The searched focussed on specific keywords: “pedestrian safety”, “electric vehicles”, “hybrid vehicles”, “cyclists’ safety”, “traffic sounds”, and “auditory perception”. This resulted in a list of 2 publications.
Findings and Results
TCO
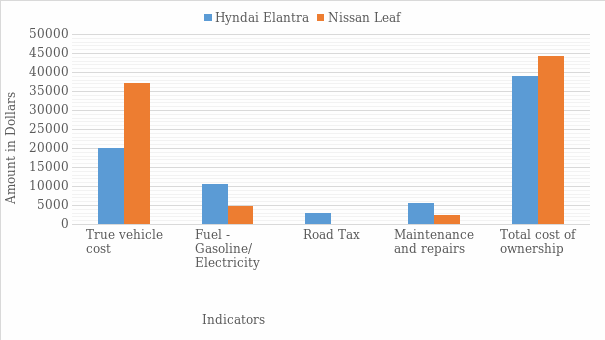
The findings presented in Figure 1 illustrate the variation between the overall TCO between the sample vehicles. The purchasing cost for the Nissan Leaf was higher than the Hyundai Elantra. However, the Nissan Leaf was low-priced to own in regards to the fuel cost, road tax, maintenance and repairs cost categories.
Environmental Impact
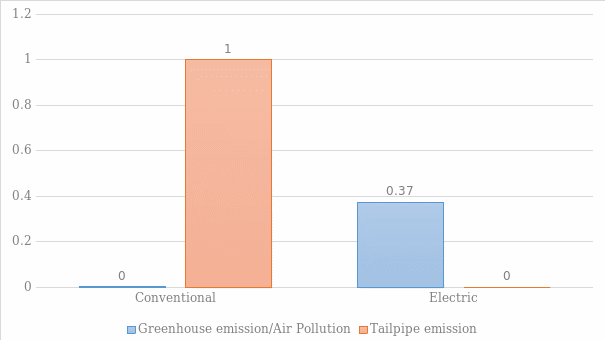
In terms of the tailpipe emission, the BEV is illustrated to have a zero tailpipe emission, while that of the ICEV is at its highest. However, when it comes to greenhouse emission and air pollution, the BEV is seen to have a notably higher emission that the ICEV.
Discussion
The results in Figure 2 illustrate that the redacted operating expenses of BEV offsets the higher initial cost relative to ICEVs. TCO is rather a broad concept on the basis that it contradicts the typical observed behaviour, which is, purchasing price, used car buyers. If shoppers assume a similar structure cost for BEVs and ICEVs, then they are running into the danger of making uneconomic budgeting and environmental decisions. Currently, the primary factor influencing the purchasing value of BEVs is the price of the battery pack.
However, according to Hagman et al. (2016), the value of lithium-ion batteries is expected to fall in the future; hence, this will make BEVs competitive in terms of both the purchasing price and TCO. The other factor includes policies such as road taxes and fuel-economic standards. These policies function as economic instruments; therefore, they play a crucial function in bridging the gap between EVs and ICEVs with regards to the TCO. For instance, the BEVs not falling into the “premium category” are not subjected to any Vehicle Exercise Duty; however, all conventional vehicles are required to pay the road taxes.
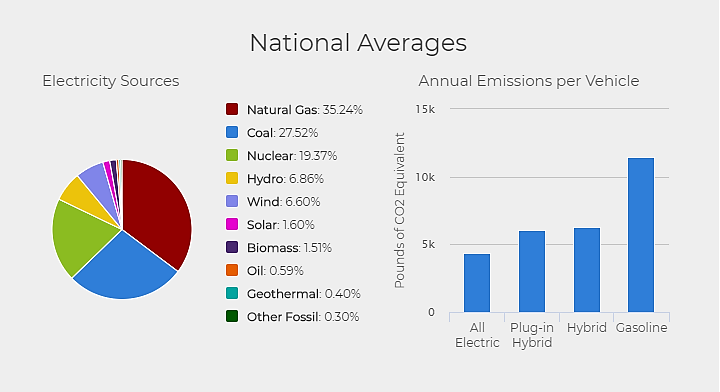
The results in Figure 3 illustrate that although the BEV has a zero tailpipe emission, it still contributes to climate change with regards to its manufacturing. From an environmental outlook, the image is even more multifaceted. BEVs attain the objective of minimising GHG emissions in relation to the comparable conventional vehicles when the vehicles’ lifetime at taken into consideration. Nonetheless, this masks the heightened impact on human health and other secondary effects on the environment.
On a well-to-wheel basis, the GHG emissions are lower than that for the ICEs (see Table B-1). However, the net benefits of EV with regards to GHG emissions savings are dependent on the power mix throughout the entire value chain; in other words, their life cycle. It is also dependent on the real-time charging behaviour of EV users, and the fuel mix of electricity generation occasionally changes (see Figure C-1).
As a result, BEVs are capable of leading to more widespread and detrimental sets of environmental impacts, which will consequentially offset a substantial measure of their general advantage relative to GHG emissions. Notably, the employment of heavy metals in the development of lithium-ion battery packs blended with the pollution produced by the region’s power grid is estimated to result in thrice the volume of human toxicity in relation to ICEVs (Muneer, Kohle & Doyle 2017).
Furthermore, as presented in Egede (2017), most of the graphite and cobalt entering into the production system of lithium-ion batteries is obtained from poorly regulated and massive polluting mines in China and Congo (Muneer, Kohle & Doyle 2017).
Therefore, while the BEV users attempt to minimise their local contribution to GHG emission, they are instead creating a more diffused array of adverse environmental impacts across the world, after-effects that are largely endured by disadvantaged and rural communities near regions where lithium is sourced from.
The relative high presence of electric vehicles in roadways has raised some safety concerns regarding vehicle’s inherently quiet operation, which might prove to be dangerous to the BEV drivers, pedestrians and others, particularly bicyclists. The results of this study are mirrored by Tataris (2014) that found that the probability if an EV being in a pedestrian crash is 22% higher than the likelihood of an ICEV.
Moreover, according to Steling-Konczak, Hagenzieker and Van Wee (2015), hybrid electric cars are associated with a higher frequency of accidents among roads users listening to electronic devices. The high frequency of accidents was attributed to the quietness of electric cars at low speeds.
On the other hand, other studies illustrated a direct relationship between the quiet ambience of hybrid electric cars and vulnerable road users. In Garay-Vega et al. (2011) the participants, who were blind took longer to detect HEVs regardless of their speed.
Conclusion
Over the years, there has been a rise in the demand for BEVs, which is attributed to a lower TCO and “environmentally friendly” capacity as they have no tailpipe emissions. The sales of electric vehicles is expected to increase significantly.
However, research has revealed that although BEVs are generally cost-effective as compared to their ICEVs counterparts, there are potentially unsafe and unintended consequences associated with the silent engines that the EVs operate on. The manufacturing of the lithium-ion battery poses severe environmental damage and also the lack of propulsion noise from the combustion engine is a far higher risk to pedestrians and cyclists.
Reference List
Chau, K 2016, Energy systems for electric and hybrid vehicles, Institution of Engineering and Technology, London.
Garay-Vega, L, Guhty, C, Pollard, J & Hastings A 2011, ‘Auditory detectability of hybrid electric vehicles by blind pedestrians’, Journal of the Transportation Research Board, vol. 2248, no. 1, pp. 68-73.
Egede, P 2017, Environmental assessment of lightweight electric vehicles, Springer Publishers, Switzerland.
Environmental Protection Agency 2019, Greenhouse gas emissions from a typical passenger vehicle, Web.
Hagman, J Ritzen, S, Stier, J & Susilo, K 2016, ‘Total cost of ownership and its potential implications for battery electric vehicle diffusion’, Research in Transportation and Business Management, vol. 18, no. 6, pp. 11-17.
Muneer, T, Kohle, M & Doyle, A 2017, Electric vehicles: prospects and challenges, Elsevier Science Publishers, New York, NY.
Schwanen, T 2019, ‘The five major challenges facing electric vehicles’, BBC News, Web.
Steling-Konczak, A, Hagenzieker, L & Van Wee, A 2015, ‘Traffic sounds and cycling safety: the use of electronic safety devices by cyclists and the quietness of hybrid and electric cars’, Transport Reviews, vol. 35, no. 4, pp. 1-23.
Tataris, K 2014, ‘National Highway Traffic Safety Administration (NHTSA) notes’, Annals of Emergency Medicine, vol. 64, no. 2, pp. 196-197.
Appendices
Appendix A: BEV Sales
Appendix B: Total Cost of Ownership
Table B-1: Car Model Specifications. Sources: Fuel Economy 2019, 2019 Nissan Leaf (40 kW-hr battery pack). Fuel Economy 2019, 2019 Hyundai Elantra.
Table B-2: Total Cost of Ownership for a Compact Car. Source: Author.
Appendix C: Environmental Impact

Table C-2: Normalised environmental indicators. Source: Author.
