The given task is aimed at answering the question of whether there was a possibility of electrification of the Electrical Engineering (EE) building at UNSW using wind energy. The purpose of this fact-finding mission was to determine an appropriate type and rating of the wind turbine based on three factors: the average wind data (such as wind speed) at UNSW; the peak power demand for the EE building; and where the turbine would be installed. Safety issues, such as turbine height and noise level influence the place where the analyzed installation takes place. The research was undertaken between July 2010 and June 2011.
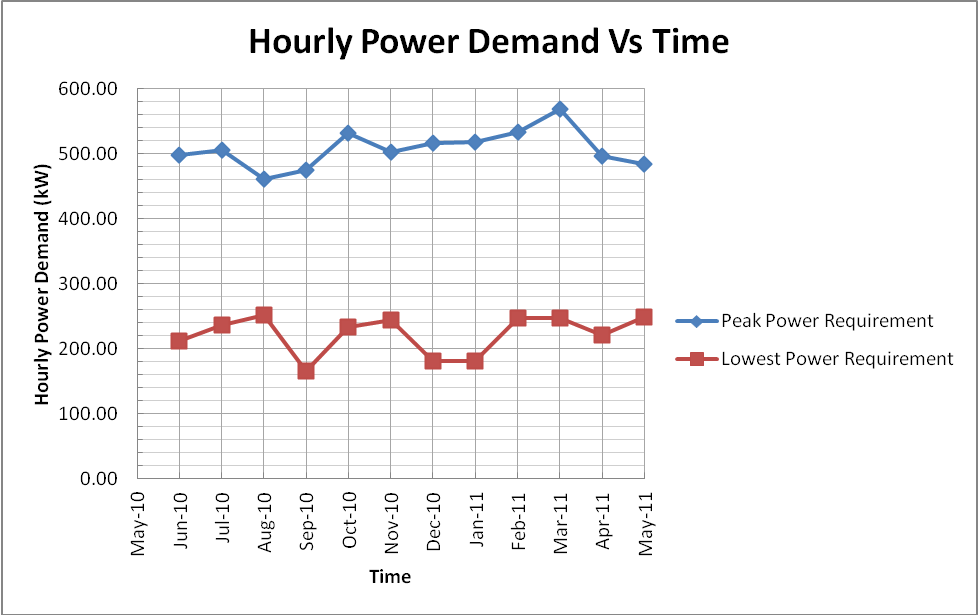
During the fact-finding mission, we collected data and considered several scenarios. According to Blakers (2000), the average wind speed at UNSW is over 8 m/s at 50 m above the ground. This speed increases in the afternoons (Coppin, Ayotte, and Stegel, 2003). From Appendix, I, the hourly peak power requirement for the EE building was established to be 568.44 kW. From Table I (attached), the total energy required by the EE building is 2749039 kWh per year. We would suggest that the turbine be installed on the top of the Electrical Engineering building. The installation of the turbine was introduced in order to avoid disruption of wind by buildings. In addition, the increase in altitude is favorable since high wind speeds occur at elevated levels (Blakers, 2000). Provided the turbine does not interfere with the normal functions of the institution, we suggest that it was not necessary to place restrictions on the height of the turbine. In addition, the height of the tower should be limited to between 1.5 times to 3 times the radius of the rotor (Edelstein et al., 2003). We settled on 1.95 times the rotor radius, as a compromise between maximum wind speed harnessed and cost of tower installation.
There was only one safety issue; the risk of fire. This was found to be extremely minimal, although it may arise as a result of sparks from turbine equipment, lightning, strikes, and the likelihood that fires would begin during construction or during repair works. So far, only two cases, out of 40, have been reported. There are two kinds of noise emanating from a wind turbine; aerodynamic noise and mechanical noise (Hau, 2000). Aerodynamic noise is caused by the rotor blades, while mechanical noise is caused by the gearbox. A small amount of noise can also be emitted from the moving parts of the turbines. The design of present-day turbines ensures that they minimize noise level (Edelstein et al., 2003). This is confirmed by Sustainable Development Commission (United Kingdom) that states that people can stand beneath a turbine and have usual conversations without raising their voices (SDC, 2005).
During the selection of the type and rating of the turbine, several scenarios were considered. The horizontal axis design was chosen for the vertical axis. More often, this turbine is not placed upwind of the supporting tower to minimize the effect of turbulence produced by the tower. The cost of a vertical axis-designed turbine is high since it requires a high torque due to the lower rotational speeds. Difficulties were also encountered when modeling, analyzing and designing the prototype rotor for vertical axis turbines. (Brower, Robinson and Hale, 2010). We also avoided selecting floating windmills because of the high cost of the utilities; usually, it is 50 to 100 % above the cost of land-based equipment (Fossdal et al., 2007).
Selecting the optimal horizontal axis wind turbine is dependent on maximizing the capacity factor (Changa and Tua, 2007; Akpinar and Akpinar, 2005). Therefore, according to Nemes and Munteanu (2011), the chosen parameters for the turbine should be equivalent to those of the wind profile area. 72 m was chosen to be the diameter of the rotor blade in order to reduce the cost of utilities and maximize on tower height. A smaller diameter would not produce sufficient energy to cater for the electricity need of EE Building. A capacity factor of 0.34 was chosen to help with the calculation of power output required. Using this capacity factor and the maximum power required by the EE Building, we find that the required turbine will have a rating of 1.5 MW (See Appendix II). This is confirmed by Tables II and III, where such issues as wind speeds, rotor diameter, and power output are compared to each other. Table IV gives the technical specifications of the selected horizontal axis wind turbine.
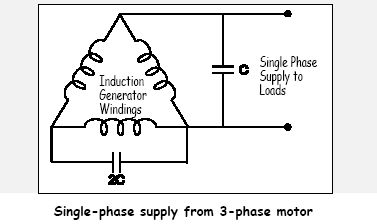
The important issue of having the output of the generator driven by the wind turbine contained three phase AC voltage, with varying frequency and amplitude, while the EE building requires a fixed 240V, 50Hz single phase supply, can be easily solved. A transformer with a primary Delta (3-wire) and a secondary Star (4-wire and center-earthed) solves this problem. Either two phases and the neutral, or a single phase and the neutral should be used when designing the EE building.

Although the wind speed is intermittent, this intermittency can be addressed quantitatively using the mathematical models and computer simulations for generation of probability distributions for wind speeds and electricity demand (Diesendorf, 2003/04). Storage is needed to avoid power outages in case there is insufficient wind energy. A combination of fuel cells that are hydrogen powered and wind power (Fossdal et al., 2007) could be utilized. When production is above demand, electrolysis produces hydrogen. This hydrogen is then amassed in pressure tanks. It could be used later when there is insufficient production of wind power (Fossdal et al., 2007).
References
Akpinar, E.K. and Akpinar, S. (2005).An assessment on seasonal analysis of wind energy characteristics and wind turbine characteristics. Energy Conversion and Management 46, pp. 1848–1867.
Blakers, A.W. (2000) Solar and Wind Electricity in Australia. Australian Journal of Environmental Management, 7, pp. 223–3.
Brower, M.C., Robinson, N.M., and Hale, E. (2010) Wind Flow Modeling Uncertainty. AWS Open-Wind. Web.
Changa, T-J. and Tua, Y-L. (2007) Evaluation of monthly capacity factor of WECS using chronological and probabilistic wind speed data: A case study of Taiwan. Renewable Energy, 32, pp.1999–2010.
Coppin,P.A., Ayotte, K.A, and Stegel, N. (2003) Wind Resource Assessment in Australia – A planners guide. Wind Energy Research Unit – CSIRO Land and Water. Web.
Diesendorf, M. (2003/04) Why Australia needs wind power. Dissent, 13, pp.43-48.
Edelstein, W.A., Waleck, C.J., Cox, D.L., and Davis, L.C. (2003) Wind Energy: A report prepared for the Panel on Public Affairs (POPA). American Physical Society.
Fossdal, M.L., Arnstad, E., Mathiesen, K.B., Eriksen, B. (2007) Renewable energy. Oslo: Thoresen Grafisk AS.
Hau, E. (2000) Wind Turbines – Fundamentals, Technologies, Application, and Economics. Berlin, Germany: Springer.
Nemes, C., and Munteanu, F. (2011) The wind energy system performance overview: capacity factor vs. technical efficiency. International Journal of Mathematical Models and Methods in Applied Sciences, 5(1).
Sustainable Development Commission (UK) (SDC) (2005) Wind Power in the UK: A guide to the key issues surrounding onshore wind power development in the UK. Government of the United Kingdom, England. Web.
Appendix I

Appendix II
Annual Energy Output = Turbines Power Rating * Capacity factor * Time 2749039 kWh = TPR * 0.24 * 24 * 365
Therefore, TPR = 1.308 MW = approx. 1.5MW
The “extra” energy covers for plant margin and operation reserve.
Table II: Power ratings for different rotor design diameters (Danish Wind Energy Association, (2002).
Table III: Wind Turbine Power Curve (Calculated using the Power Calculator).
Table IV: Technical specifications of the selected horizontal axis wind turbine.