The introduction of the newest technologies has a direct influence on processes performed within all types of organizations. The implementation of Electronic Health Record (EHR) technology in most health-care facilities is no exception to the trend mentioned above, as it alters numerous processes. Therefore, the objective of this paper is to make an attempt to understand and assess one of the processes commonly conducted in an ordinary health-care facility and improve it, representing the major steps related to the process by developing a swimlane diagram.
The process under consideration involves generating clinical documentation about a patient. It is a fundamental process that affects further treatment and health outcomes, especially in cases of readmissions and renewing prescriptions. This process covers storing and organizing information about patient assessment, laboratory tests, procedures, prescriptions, and all services delivered within one course of treatment. The process is triggered every time a new patient is registered and results in a detailed chart containing patient information that is later used-by health care staff and the patients themselves. Commonly, this process incorporates the following steps:
- Registering a patient;
- Obtaining personal data, including billing details;
- Collecting patient assessment data;
- Gathering laboratory test results;
- Obtaining prescription information;
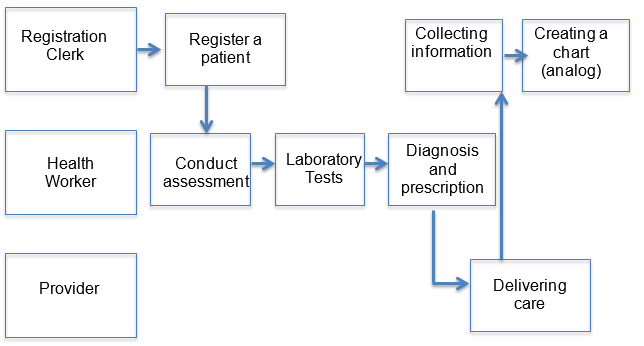
- Organizing and storing all information so that it meets the criteria of wholeness, accuracy, and readability (for details, see Figure 1—swimlane diagram).

In order to improve the current process, it is essential to recognize the risks connected to it. The most significant risk is the loss of information, especially in the case of numerous tests and procedures. This problem may also be triggered by the usual habit of filling in charts at the end of the shift or after the course of treatment. At the same time, it is critical in the case of numerous readmissions, when losing vital patient information is a recurring problem (Cimasi, 2014).
This leads to impaired quality of care, thus violating the mission and vision statements of most health-care facilities as well as impacting their ability to achieve their primary objectives. Moreover, there is a risk of differences in filling in charts in the case of several registration clerks, which can make charts complicated to read or affect the facility’s compliance with national standards (Wolper, 2013). That said, the central challenge of the as-is process is that information is stored in paper format, making the risk of loss or errors significant.
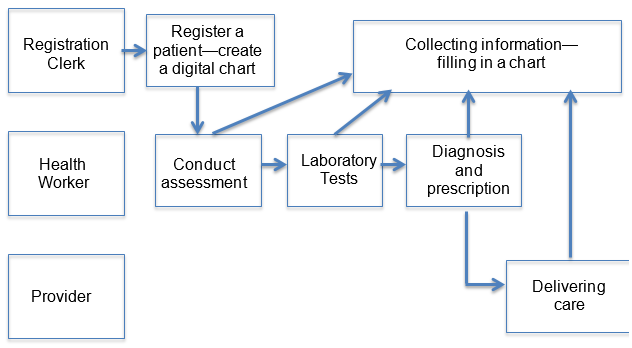
Therefore, the central change in the to-be process is the implementation of EHR and digital charts. It will minimize the risks of losing patient information due to the potential reduction of the volume of paperwork and the number of analog charts because all information about one patient will be stored in one file (Cimasi, 2014). The primary difference is that patient information will be collected and recorded during assessment and right after tests and procedures, not at the end of the shift or the course of treatment. At the same time, all charts will be developed under the same framework so that the readability risks are minimized (Wolper, 2013). That said, the improved process eliminates redundant paperwork. See the swimlane diagram for the new process in Figure 2.

References
Cimasi, R. J. (2014). Healthcare valuation: Four pillars of healthcare value. Hoboken, NJ: Wiley.
Wolper, L. F. (2013). Physician practice management: Essential operational and financial knowledge (2nd ed.). Burlington, MA: Jones & Bartlett Learning.