Introduction
Supply and demand are the most basic concepts of economics. Demand is the quantity of goods desired by consumers while supply is the amount of goods the producers can offer to the market (Begg & Dornbusch, 2005).
Quality demanded is the amount of goods consumers are willing to buy at a certain price while. Quantity supplied is the amount of goods producers can avail to the market at a certain price. Demand is usually sensitive to changes in price (Lipsey & Chrystal, 2004).
A Simple Supply and Demand Schedule
At any price, there is a corresponding quantity of goods supplied (Lipsey & Chrystal, 2004). Supply schedule is a list of prices and the corresponding quantities of goods supply (Parkin et al, 2005). Demand is usually inversely proportional to price.
Consumers demand more of a good when its price is lower (Begg & Dornbusch, 2005). On the contrary, the supply curve is upwards sloping. Producers tend to supply higher quantities of a good to the market when its price is high. They do this in order to maximize profits (Parkin et al, 2005). Below is an example of supply schedule for ice cream cones.
Supply and Demand Equilibrium – A Graphical Illustration
A situation when supply and demand are equal is known as equilibrium (Parkin et al, 2005). The producers are supplying exactly the same quantity of goods consumers are demanding (Samuelson & William, 2004).
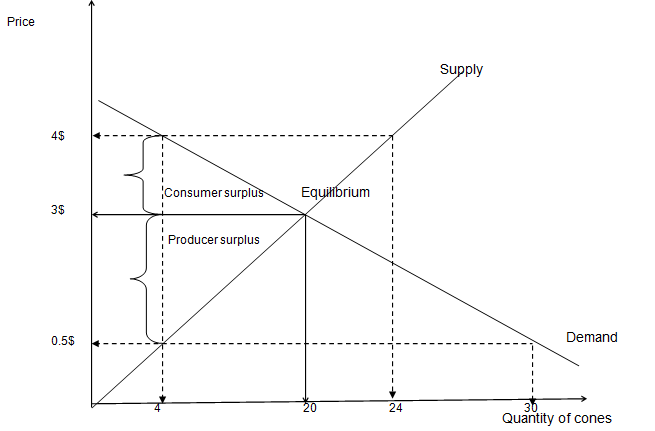
Producers sell all goods they have produced while consumers receive all the goods they demand. The equilibrium price is also known as the market price. Consider the following demand and supply curves for ice cream cones. In the diagram below, the equilibrium price is 3$ while the equilibrium quantity is 20 ice cream cones.

Consumer Surplus and Producer Surplus
Consumer surplus or producer surplus occurs when price is above or below the equilibrium price. Consumer surplus is the variation between the highest price consumers can pay and the equilibrium price (Parkin et al, 2005). In this case, the maximum price consumers can pay is 4$ while the equilibrium price is 3$.
This difference (4$-3$) represents consumer surplus. Producer surplus is represented by the difference between the equilibrium price and the minimum price producers can charge (Parkin et al, 2005). In this case, the equilibrium price is 3$ but the minimum price producers can take is 0.5$.
This difference (3$-0.5$) represents producer surplus (Lipsey & Chrystal, 2004). The above diagram illustrates consumer surplus and producer surplus relative to the equilibrium price and the equilibrium quantity.
Conclusion
The theory of demand and supply is an integral component of economics (Begg & Dornbusch, 2005). At the equilibrium point, the economy is said to be very efficient in allocating resources. Hence, at equilibrium, there are no market inefficiencies (Lipsey & Chrystal, 2004).
Since prices of goods and services keep changing, it is impossible to achieve market equilibrium in reality. Any change in price distorts the equilibrium condition thereby creating consumer surplus or producer surplus (Samuelson & William, 2004). Excess supply or excess demand is known as market disequilibrium.
References
Begg, D., Fischer, S., & Dornbusch, R. (2005). Economics (8th ed.). New York, NY: McGraw Hill.
Lipsey, R., & Chrystal, K. A. (2004) Economics (10th ed.). Oxford: Oxford University Press.
Parkin, M., Powell, M., & Matthews, K. (2005) Economics (6th ed.). London: Pearson Education.
Samuelson, P. A., & William, D. N. (2004). Economics. McGraw-Hill/Irwin.