Introduction
The February cyclone which hit most of the fruits farms between Caddwell and Innisfail in Australia has greatly affected the demand and supply of bananas in the markets compared to previous years. From the article it is clear that after the catastrophe, the supply of this crop lowered greatly leading to a rise in its prices as well as its demand. It also showed how the increase in the prices facilitated to more supply for more income.
Background Study
Theory: Increase in supply of a product or service leads to reduction in its demand and price, while decrease in its supply leads to a higher demand and price. When the supply of a commodity lowers, its demand lowers due to acceleration in its prices. More often the increase in demand of a commodity leads to an increase in its supply due to the higher prices it is accorded. When there is an over-supply, the demand and the prices are very low. This is the case in Australia after Yasi Cyclone destroyed banana farms affecting their supply (Weekly Times 2011, 2).
Models: In economics, it is fundamental to understand the concept of demand and supply of a commodity or service in the market. Usually, this concept is primary as it is seen as the backbone of economics. Demand can be defined as the quantity of a product or a service required by the buyers while supply is the much that is available in the market at a given price. Supply and demand will always reflect on the price. Graphs have been used as models to explain this concept.
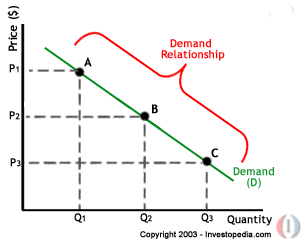
Law of demand; as the price of a commodity increases, its demand decreases. People are not always ready to forgo other valuable products or services at the expense of others that see their prices go up due to their lower supply (Baumal & Blinder 2010, 66). The curve will depict a downward slope as illustrated below.

A, B and C are points on the supply curve. From the above curve, there is a direct correlation between price and demand whereby at a point e.g. C, the quantity in demand will be Q3 at a price P3.this also applies to points A and B.
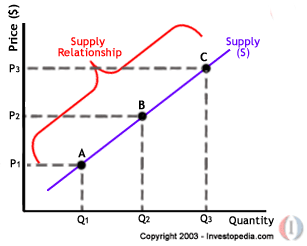
Law of supply; it shows the amount of goods and services that are available and are sold at a certain price. Supply graph depicts an upward slope. Usually the higher the prices the higher the supply as opposed to the law of demand. This is attributed to the fact that when the prices are higher, sellers will always be ready to release their products or services because it will mean increased revenue by selling large quantities at this increased prices (Baumal & Blinder 2010, 66).

On the above curve; A, B and C are points in the supply curve. There is a direct correlation whereby the quantity in supply at point e.g. B, the supply quantity will be Q2 at a price P2.This relationship is also applicable at points A and B.
Equilibrium; A state of equilibrium may be achieved when the supply equals the demand. This is usually the ideal condition for a market neither the demand nor the supply will be too high or too low thus creating a fair price for the commodities. Usually this economic status is satisfying because the consumers get what they require while the suppliers do not go at a loss due to their commodities going bad or staying in the market for so long.
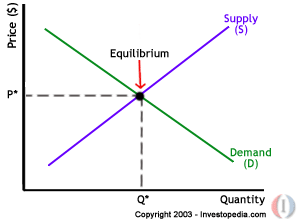
Equilibrium is attained when demand curve intersects supply curve. In real market; equilibrium is only achieved theoretically as the demand and supply keep on changing so is it to the prices (Baumal & Blinder 2010, 63). The graph below gives a picture of economics equilibrium;

In the above chart where the demand and supply intersect is known as equilibrium* is the good’s price and Q* is the quantity, known as equilibrium price and quantity respectively.
Analysis

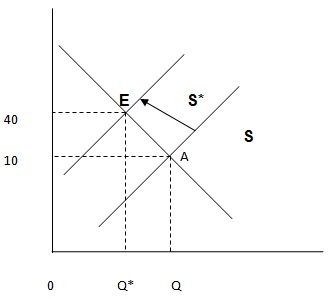
The supply of a commodity can decrease due to so many factors like catastrophes such as floods, droughts, tsunamis, cyclones and many more. In this case, the bananas supplies in North Queensland diminished due to the Yasi Cyclone that hit the country. In the previous year, there was surplus in the market pushed prices down to $10 per box. Reduction in supply forced the prices for bananas to increase from $10 to $40.
However, the occurrence of the Yasi cyclone reduced supply that caused a shift in the supply curve from S to S*. The equilibrium in the market shifts from point A to pint E. the pressure in the prices was due the reduction in the amounts of banana supplied represented by Q-Q*. This decline caused prices to increase from $10 to $40.This being a shift to the left implies hat supply decrease while demand remains constant (ABC Rural 2011, 13).
As supply declined there were more money chasing few goods in the market and hence forcing prices to increase steadily. The prices are expected to remain high till next season when the demand increases (The Sydney Morning Herald 2011, 10). The above scenario best illustrates the law of supply where the supply goes up as the prices and the demand also accelerates (Weekly Times 2011, 8).
The high prices and demand of the commodity also facilitated the thought of importing the product from other countries i.e. Philippines so as to meet the consumer need. This is to increase the supply of the commodity to meet the demand at a higher price.
More and more bananas were taken to the markets on the south, and as the supply continued to lower a week after another the demand also increased. When demand equals supply this state is termed equilibrium. This state was not achieved besides all the efforts to increase supply though there was anticipation for such a state when the conditions stabilize.
Conclusion
Conclusively, the above supply and demand laws comply with the state in Australia before and after the cyclone in relation to banana supply in the market as depicted in the article. Previously, there was an oversupply which resulted in low prices as well as demand. After the strong winds, many banana plantations were destroyed leading to reduction in its supply. This eventually led to increased demand and a rise in its price.
References List
ABC Rural. Prices go banana, but it could have been worse, 2011. Web.
Baumol, Willam. Blinder, Alan. Macroeconomics; principals and policy. ed. 11, US, Cengage Learning, 2010.
Eslake, Saul. They’ve gone bananas. The Sydney Morning Herald. 2011. Web.
Weekly Times. Banana prices set to climb, 2011. Web.