Introduction
The main objective of this report is to investigate the relationship between the gross income of movies and the type of movie. There are several movies at the box office that are highly rated. The preference of people to watch certain types of movie impacts their gross income.
The movie industry generates billions of dollars each year through producing movies. The earning of a movie is affected by its cinematic hype, audience expectations, ticket sales, and other factors that also affect the movie ranking at the box office. With the passage of time, the film genre is often linked with the gross income of movies. Therefore, it is critical to assess the relationship between the type of movies and their gross income. In this report, Pearson Correlation, Chi-Square Test, and linear regression are calculated to investigate the stated relationship.
Information/measurement
The data of fifty-three (53) top rated movies is gathered from a reliable website. The movies are randomly selected based on their box office ranking and income. The data of movies was gathered from IMDb.com, which is a well-known website for film rating and reviews and has a reliable and comprehensive database of all movies released in the U.S. Therefore, it could be stated that the data collected for this research is reliable. The data is analyzed to determine the relationship between the two selected variables including “gross income” and “type of movie” (genre). The type of movie is selected as the independent variable, and gross income is the dependent variable.
The two values assigned to the type of movie are drama as 1 and comedy as 2. In particular, correlation matrix and linear regression are used investigate this relationship. For Pearson Correlation and linear regression model, the p-value is used as a standard measure to test the significance level of the relationship between the two selected variables. Moreover, coefficient beta values are used to determine the strength of the relationship between the tested variables. Chi-Squared is also calculated in this report to test the differences in the gross income based on the type of movie. The following hypothesis would be tested in this research by using mathematical tools.
- H0: There is an insignificant, negative relationship between gross income and type of movie.
- H1: There is a significant, positive relationship between gross income and type of movie
Mathematical Processes
Standard Deviation
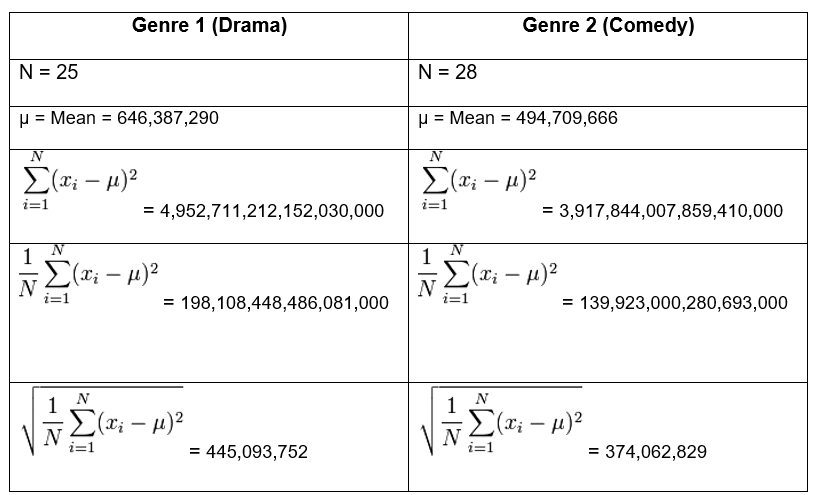
The standard deviation of the two film groups identified on the basis of the type of film is calculated by using the following formula.


The results indicate that both groups have a high standard deviation in their gross income. The high value of standard deviation could imply that there are other factors that may affect the gross income of films that are not included in this study. Therefore, it is highlighted as a major weakness of the current study, and its implications must be considered for any future study on the same topic.
Scatterplot
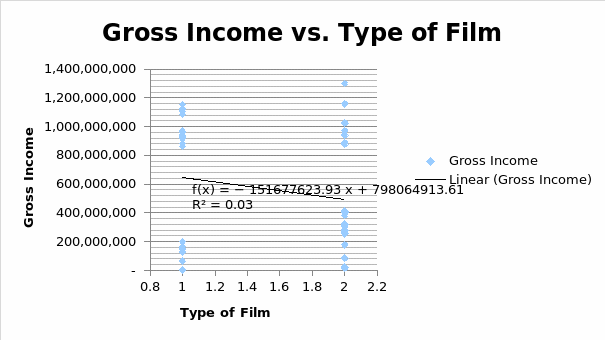
The scatterplot is prepared and provided in the following. It could be noted that gross income is on the Y-axis as it is the dependent variable and type of film is on the X-axis as it is the independent variable.

The scatterplot also indicates the regression equation and value of R-squared. The linear trend line indicates a negative relationship between gross income and type of film, which is further tested by other statistical tests. The low value of R-squared implies that the model implemented in this study only explains 3.3% of the total variations observed in the data collected. The results obtained from the study may be considered weak, and it could be suggested that further classification of data based on the type of film should be made to improve the results of statistical testing.
Chi Square
Case Processing Summary
Table 2: Chi-Square Test
The results obtained from Chi-Square Test shows a value of more than 20 percent that implies that a different course of action should be taken as it has violated the expectation of Chi-Square Test. Based on the results of Chi-Square Test, it can be seen that Pearson Chi-Squared value is greater than the p-value that indicates that the alternative hypothesis is rejected and the null hypothesis is accepted. It implies that there is an insignificant difference in the gross income of drama and comedy films.
Linear Regression
Table 3: Regression Analysis
The regression analysis is conducted to determine the relationship between gross income and type of the movie of selected movies. The output of the regression analysis shows that the p-value is 0.192 that is greater than the confidence level of 0.05. It indicates that there is an insignificant relationship between gross income and type of movie. Moreover, the coefficient value of -.0.182 indicates that there is a negative relationship between gross income and type of movie based on the selected set of movies. It indicates that a comedy film is likely to have lower income than a drama film.
Pearson Correlation
The results obtained from Pearson Correlation shows that there is an inverse relationship between gross income and type of movie. The value of correlation coefficient is -0.182 that indicates that there is an inverse relationship between gross income and type of movie that implies that comedy films are likely to earn less than drama films. However, the significance level value is 0.192 that is greater than the standard p-value, 0.05. It indicates an insignificant relationship between the two variables.
Table 4: Pearson Correlation
Interpretation of results
The results obtained in this research indicate that the type of movie and its gross income do not have any significant relationship. It indicates that the type of movie does not have any significant impact on its gross income. In other words, it can be stated that the three mathematical calculations show similar results. However, the standardized value for each test varies.
It could be stated that the results of this study support each other. All three statistical tests including linear regression, Pearson correlation, and Chi-Square Test showed an insignificant, inverse relationship between type of movie and gross income. From the results, it can be noted that drama movies are likely to perform better on the box office than comedy movies.
However, the preference of viewers and other factors such as their play time at theaters, year of release, cast, and plot and period are some of the other factors that may impact the gross income of a movie. The gross income of movies may be affected by these factors that are not considered in this study.
Furthermore, the study indicates that the type of the movie has an inverse relationship with the gross income of films. It implies that drama movies are likely to have higher gross income than comedy movies based on the values assigned to them for the analysis. The results of Pearson Correlation and linear regression showed similar values of beta and p-value, and based on these values it could be indicated that the alternative hypothesis is rejected and the null hypothesis is accepted.
- Rejected: H1: There is a significant, positive relationship between gross income and type of movie
- Accepted: H0: There is an insignificant, negative relationship between gross income and type of movie.
Validity
In this research, the gathered data is analyzed using mathematical tools to draw results regarding the two hypotheses. The gathered data was quantitative due to which the use of mathematical tools was considered appropriate. The reason to use mathematical testing to investigate the relationship between the selected variables is that it makes it easier to summarize large data. The results obtained are coherent and systematically show the relationship between the variables.
The use of the mathematical process for interpreting data is considered reliable than other means of analysis. The arguments of validity are considered reliable because the conclusion that is gained from statistical testing is based on assumptions derived from the application of legal, mathematical operations. For this study, mathematical tools were used to test the relationship between the two variables including type of movie and gross income.
It could be noted that two hypotheses were set at the outset of the study and using three different mathematical tools tested them. The gained results indicated that the null hypothesis is accepted based on the coefficient values, Chi-Squared value, and p-value obtained from mathematical tools. The data of 50 movies was analyzed by using MS Excel and SPSS to determine the relationship between the chosen variables. Moreover, the results were checked by manual calculations. It could be concluded that the mathematical methods used in this research and their results are correct and reliable.