Introduction
The purpose of this paper is to develop a comprehensive and an in-depth analysis of the financial performance of Suleiman A. G, a German corporation specializing in the manufacture and distribution of a wide range of machine tools and robots on the international market. The analysis will focus on the company’s first four years of its 21st century business, which proved to be an important turnover due to a high rate of increased profitability. The report aims at providing the stakeholders with the right, correct and concise information regarding the company’s financial health in order to help them in critical aspects of their decision making in regards to their investments in the company.
Analysis of the corporate sales growth
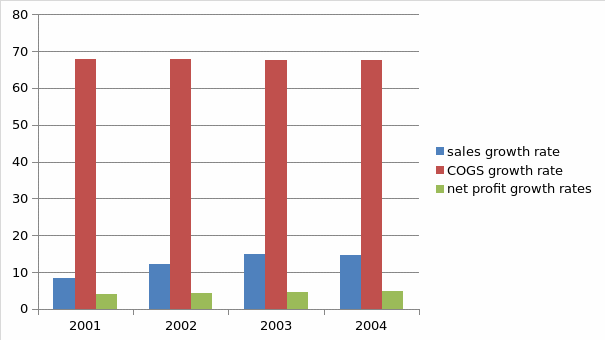
An analysis of the company’s profit and loss statements for 2001 and the three consecutive years provides a clear indication that the rate of sales growth was increasing significantly. At the end of the 2000 financial year, the company’s balance carried forward in terms of sales was $240 million. However, it recorded an increase of more than $19.9 in the 2001 financial year, which translates to 8.3%. In fact, this was the company’s most significant indication that its financial health was set to increase in the new century. For instance, in the two consecutive financial years, the growth rate continued to increase rapidly, recording 12.1% and 14.9% in 2002 and 2003 respectively. However, the sales growth rate stagnated in 2004, recording a slight reduction of about 0.2%. Noteworthy, the rate cost of goods sold remained statistic at an average rate of 67.75%, providing adequate evidence that the company’s revenue in terms of sales was experiencing a constant increase. In addition, it provides insights into a possible increase in the corporate profitability, especially when other expenses such as depreciation, interests, taxes and other payables remain stagnant. The charts below provide a visual analysis of the company’s sales performance for the 2001-2004 financial years.

Analysis of Operational Leverage
In this category, the rate of growth for the cost of sales (cost of goods sold) and administrative and selling costs are important determinants of operational leverage.
As indicated above, the cost of goods sold for the four consecutive years remained fairly constant. For instance, in 2011, the company’s cost of goods sold was 67.9% of the previously recorded amount. However, the rate of increase remained fairly constant over the next three fiscal years, averaging at about 67.75% per annum. A stagnating rate of growth in the cost of goods sold provides an insight into the company’s performance and the overall state of the business environment (the economic environment). For instance, the company makes relatively few sales, with each sale yielding a relatively high gross margin because the annual increase in the rate of sales was relatively high. From this perspective, it is worth saying that the company was highly leveraged.
At Suleiman AG, the administrative and selling expenses were experiencing a slight decrease in terms of annual growth rates. For instance, in 2011, the expenses increased by 16.0% per annum but reduced to 15.8% per annum in 2002. In addition, it decreased slightly from 15.6% in 2003 to 15.45 in 2004. This is an indication that the degree of leveraging in the four consecutive fiscal years was significantly high.
RoIC and value creation levers
The measure of value creation for the investments by shareholders is an important aspect of corporate financial analysis, especially for a traded company like Suleiman AG. Therefore, an analysis of the return on capital invested (RoIC) is an important measure of Suleiman’s ability to create value for its shareholders. The general equation for determining ROIC is given by;
ROIC= (Net income- dividends) / Total capital OR
ROIC= NOPAT/Invested Capital (CE)
The table below provides a simplified analysis of ROIC recorded at Suleiman between 2001 and 2004.
The table above provides evidence that the company’s ROIC was increasing significantly, providing shareholders with a good value of their investments. It provides highlight into the corporate’s approach to increase in the shareholder value, especially by increasing the percentage allocated to the shareholders in the wake of an increasing rate of income and profitability.
Sales to capital employed
The aim of determining sales to capital employed is to find out the ability of the company to generate revenues from sales by using the assets it has at a given fiscal period.
At Suleiman AG, sales to capital employed ratio remained constant between 2001 and 2004, recording a flat rate of 1.4 throughout the four fiscal years. Since the ratio is positive, it is worth noting that the company was able to use its assets to generate revenue. However, it is an indication that the firm was not interested in using additional or reducing assets in revenue generation throughout the period. It is likely that the same amount of assets used to generate capital remained constant throughout the period, despite the recorded increase in the volume and value of revenue obtained from trade.
Working capital turnover ratio
Working capital turnover ratio is used to determine the ability of an organization to use its working capital to promote or sustain a high level of sales revenue. In the case of Suleiman AG, the value of working capital turnover ratio increased from 4.8% in 2011 to 5.4% in 2004, providing evidence of the corporation’s ability to use its working capital to generate sales revenue.
Fixed assets to sales
At Suleiman AG, the company’s fixed assets to sales ratio increased slightly from 5.9% in 2001 to 6.7% in 2004 by maintaining a slight positive improvement every year. This is a clear indication that the company was investing its assets to generate revenue from sales, which shows that the company’s financial health is relatively strong.
WACC and the Economic Profit (EVA)
At Suleiman AG, the value of WACC increased throughout the four fiscal years. It increased from 125 in 2011 to 16.7% in 2004, providing evidence of the corporation’s ability to accumulate more capital every year.