Introduction
A customer satisfaction survey investigated the degree of satisfaction with service experience, observations about the quality of service, organizational response, and how the shopper subsequently behaved. The study yielded 104 responses. The present section focuses on testing the following alternative and null hypotheses:
Concerning word-of-mouth:
- H01: The overall satisfaction with the company will not influence the likelihood of recommendation or positive word-of-mouth.
- HA1: The overall satisfaction with the company will influence the likelihood of recommendation or positive word-of-mouth.
Concerning effect or emotional response:
- H02: The positive emotions of the customer following a service recovery will have no effect or decrease the likelihood of repurchase intentions
- HA2: The positive emotions of the customer following a service recovery will increase the likelihood of repurchase intentions
Results
Satisfaction with Service Experience
On the whole, the quality of customer experience with the service business leaves much to be desired. The dichotomous response of “satisfied” or not (see Table 1 in the Appendices) reveals that dissatisfied customers outnumber the pleased patrons about 3 to 2. In the absolute, this is disastrous given that business enterprises declare it their mission to maximize customer satisfaction. Secondly, the results suggest better than even odds that any customer in the future will come away dissatisfied. Yet a third source of concern is the multiplier effect of a frustrated customer communicating a disappointing experience to others (see following section B).
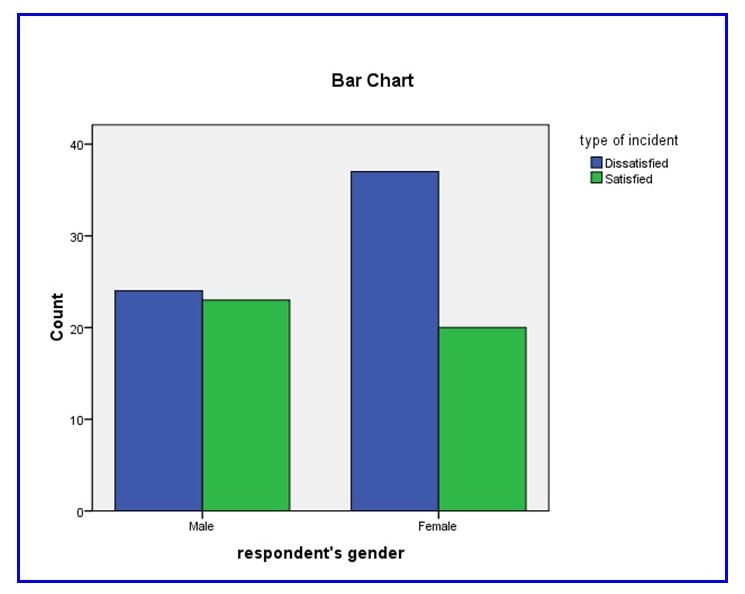
Analyzing the above outcome by the available socio-demographic information, one finds first of all that women are more likely to come away dissatisfied (Tables 2, 3, and Fig. 1 in the appendices). However, the chi-square test – applicable in this case because the classifying independent variable is binomial – is borderline and does not affirm that the difference vis-à-vis men could not have occurred by chance at the commonly-accepted 0.95 confidence level threshold. Since the nonparametric test is unusually sensitive to low degrees of freedom (that is, the size of the subsample), such below-threshold significance can perhaps be retested with a larger sampling of incidents in the future.
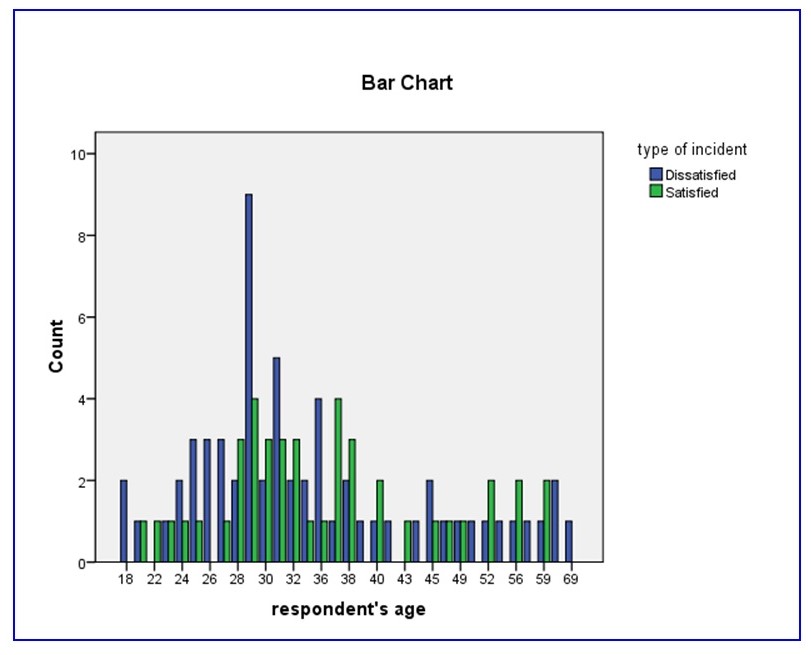
Inspected by customer ages, the raw tabulation (Table 4) is highly fragmented for spanning no less than 33 different ages. Not surprisingly, the chi-square test (Table 5) reveals a significant statistic of 0.82 at 32 df (33 ages less 1), which suggests the unsatisfactory finding that the overall distribution of differences in dissatisfaction incidence by single age may well have occurred by chance in eight of ten survey re-tries. In short, the differences by age are largely random. Nonetheless, visual inspection of Fig. 2 suggests that the incidence of dissatisfaction was greatest among 29 year-olds.
Effect on Word-of-Mouth
On a seven-point scale ranging from 1 “very dissatisfied” to 7 “very satisfied”, overall satisfaction with recent service experiences tended to be low at an average of 3.3 (SD = 2.4, see table 8 in the Appendices). Whatever the mix of service businesses that study participants had in mind and evaluated, it is clear that there exists tremendous opportunity based on being able to deliver delightful customer experiences more consistently.
There is also an opportunity in the finding that those who decided to relate their experiences to others, by whatever channel of communication, tended to be more dissatisfied (mean overall satisfaction = 3.2, S. D. = 2.42) than the tiny minority who said nothing at all to anyone (mean = 5.4, S. D. = 1.8) (Table 10). These findings stand to reason since Swanson and Hsu (2009) asserted that the consequences of service failures can include customer dissatisfaction and negative word-of-mouth, among others.
Whether these average satisfaction values differ meaningfully is another matter, however. On the face of it, the t-test result for two independent samples (across WOM/Not-WOM) yields a significant statistic of 0.02, rather handily meeting the 0.05 decision rule (Table 11). The standard interpretation for such an outcome is that the difference between the mean overall satisfaction ratings of 3.2 and 5.4 could have occurred by chance perhaps twice in a hundred re-surveys. Since it is lower than the required α = 0.05, one must reject the null hypothesis and accept the alternative stated on page 1: The overall satisfaction with the company will influence the likelihood of recommendation or positive word-of-mouth.
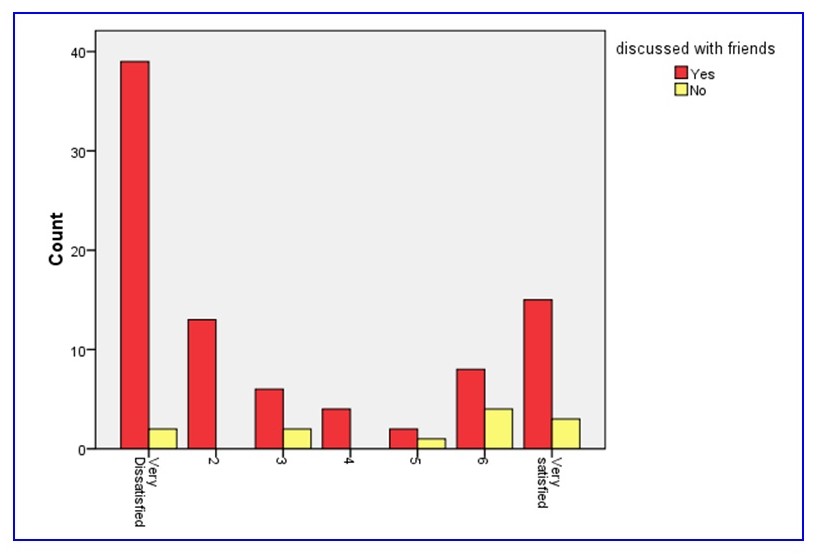
On the other hand, Fig. 4 does show that the distribution of overall satisfaction ratings is both bipolar and therefore bimodal, with a serious skew towards the “very dissatisfied” end of the scale. The assumption of a normal distribution cannot be met. The fallback is the cross-break shown in Table 12 and reverting to the nonparametric chi-square test (Table 13). The latter yields the borderline value p = 0.06, enabling one to reject the null hypothesis once again provided the confidence level is loosened to 0.90.
Effect on Repurchase Intention
To test the second set of hypotheses, we can, for simplicity’s sake, employ:
- Overall satisfaction (“satis”) as the independent variable (IV) since the database does not include the supplemental questions about the level of emotion (question 24) asked if no service recovery occurred;
- For the first dependent variable (DV), taking one’s custom away (“recovery 10” or went elsewhere) despite any attempt by the concerned business to mitigate the service failure; and,
- For a second DV, whether the shopper purchased again from the company (“rebuy”).
Procedurally, one sets up the analyses with a cross-break of each DV in turn as the column headers and the results of the overall scale of satisfaction comprising the rows of the table, as in Tables 14 and 15. Hypothesis evaluation should be possible with the t-test of two independent samples since the IV is scalar and can yield means. However, recall from section B above that the data does not follow a normal distribution but is seriously skewed toward the negative extreme of the scale. Hence, one can fall back on non-parametric measures like the Χ (chi-square) test.
The variable “went elsewhere” may be subject to emotional bias since it is so lopsided in favor of claiming not to have terminated the relationship altogether (Table 16). As it is, the 93% of survey participants who reported the service failure was not serious enough to cause them to terminate the relationship had a mean rating of 3.4 (SD = 2.4), somewhat better than the 1.6 mean (SD = 1.5) found for those who did claim to terminate the relationship. Nonetheless, it is noteworthy that even the 3.4 mean rating of those not terminating the relationship is right in the middle of the seven-point scale, suggesting a reserved kind of dissatisfaction but unhappiness nonetheless.
The second DV may present a more realistic picture. Table 17 shows that the sample was almost evenly divided among those who remained patrons (the service problem was not critical or there may have been no alternative) and those who became lapsed customers. The gap in mean satisfaction rating was also wider as those who made a subsequent purchase from the offending vendor averaged 4.61 on the seven-point scale (SD = 2.31), near the positive end of the scale and 2.3 scale points higher than the mean of 2.29 (SD = 2.0) grudgingly given by the lapsed patrons.
When Student’s t is used to evaluate the hypotheses, one finds a borderline case for the DV “went elsewhere”: p = 0.05, suggesting that the gap in mean satisfaction ratings of 1.9 scale points may well occur by chance about once in twenty sampling attempts from the relevant universe of service customers (Table 18). There is not enough evidence to reject the null hypothesis, particularly since no less than 93% of survey participants claimed to have maintained their patronage even after a disappointing service experience.
Turning to the DV as “patronized the store again or not”, one finds this time that the 2.31 difference in mean satisfaction ratings is associated with a t value of 5.424 that, at 102 df, bears the significance statistic p < 0.00001 (Table 19). Since this means that a gap of that magnitude in average satisfaction ratings could have occurred by chance less than once in 100,000 survey re-samplings, one rejects the null hypothesis and accepts the alternative: “The positive emotions of the customer following a service recovery increases the likelihood of repurchase intentions.”
Falling back on nonparametric assumptions and going by the chi-square test, the result is the same (Tables 20-21). The claim of having maintained patronage versus going elsewhere is associated with p > 0.05 and it is therefore not possible to reject the null hypothesis. On the other hand, average satisfaction ratings do differ materially (p < 0.001), enabling one to once more reject the null hypothesis and accept the alternative that overall satisfaction with complaint handling helps maintain repeat patronage.
Limitations
In theory, the findings of this survey are reliable and representative solely of accessible college-age youth and older adults, with a bias for the former, that comprised the convenience sample in Whitewater (or wherever the survey was run, PLEASE REPLACE). Since survey subjects were left free to refer to any memorable service transaction, findings are also valid for the general category of person-to-person transactions. A purchase at a consumer electronics retailer likely carries as much weight as an online pre-order transaction for the Apple iPad or a visit to a day spa. And yet, business research and policy for products, online marketing, and personal services presumably relies on a differing hierarchy of priorities.
Implications for Future Studies
Springing directly from the limitations of the present data set, the need for dynamic analysis of customer segments, and the need for action-oriented recommendations, it is vital to consider:
- A considerably larger base of survey subjects to enable rigorous comparisons by gender, income class, age, occupation, and face-to-face or online transactions.
- Refine coverage to specific service businesses to minimize the confusion with the service aspects of product marketing and retailing.
- Improve code categories so that they are more meaningful on their own, obviating the need for a decision-maker to look up the coding manual.
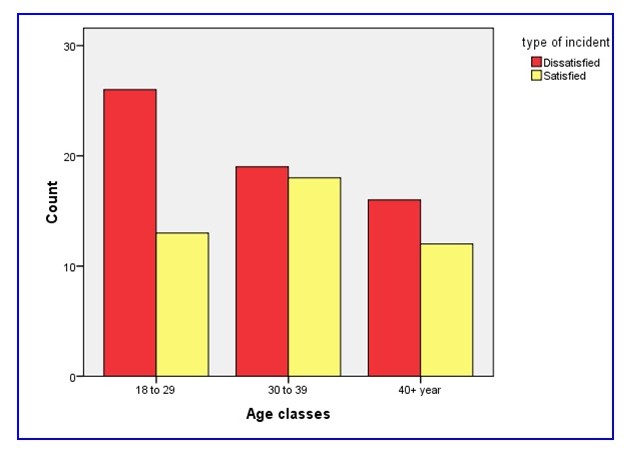
That women are liable to come away from a service transaction less satisfied bears investigating. This may be related to the nature of the service purchased or to gender-based undercurrents of customer-service personnel interactions. Greater dissatisfaction among shoppers in their twenties generally and those 29 years of age, in particular, maybe a statistical fluke or it may reflect the lower disposable income (and therefore insecurities) of students and workers still in the bottom rungs of their career ladders. Recommendations concerning a larger base enabling more thorough analysis by gender and age group should also consider other attributes.
Analyzing service faults by product/service type or transaction channel also bears implementation in future studies. A high-involvement product category is likely to generate higher service expectations as do faceless sales channels. For example, a facial cream promising better “anti-wrinkle” action might require on-the-spot demonstration on proper application or reassurances about ingredient safety as part of the service. In the case of auto or health insurance, the proof of the service pudding is tested at need, when the buyer seeks immediate and full satisfaction in return for past investments in premiums.
Appendices
Table 1: Adjudged Outcome of Customer Experience
Table 2: Satisfying/Dissatisfying Critical Incident by Customer Gender
Table 3: Chi-Square Test Result for Satisfaction Incidence by Gender

Table 4: Crosstabulation of Dissatisfaction Incidence by Age of Customer
Table 5: Test of Significance for Dissatisfaction by Age

Table 6: Dissatisfaction Incidence by AGE CLASS of Respondent
Table 7: Test of Significance for Dissatisfaction by AGE CLASS

Table 8: Descriptive Statistics for “Overall Satisfaction” Rating
Table 9: Mean “Overall Satisfaction” Rating by Whether Shoppers Engaged in Word of Mouth Subsequently

Table 10: Mean Satisfaction Ratings by Whether Shopper Engaged in Word-of-Mouth
Table 11: T-test for Overall Satisfaction Rating by Whether Shopper Engaged in Word-of-Mouth
Table 12: Cross Tabulation Between Overall Satisfaction Rating and Propensity for Word-of-Mouth
Table 13: Nonparametric Test of Statistical Significance for Mean Overall Satisfaction Rating by Propensity for Word-of-Mouth
Table 14: Crosstabulation of Overall Satisfaction Rating by Whether the Shopper Went Elsewhere and Terminated the Relationship
Table 15: Crosstabulation Between Overall Satisfaction and Whether the Shopper Ever Patronized the Company Again
Table 16: Mean Satisfaction Ratings by Whether Shopper Claimed to Have Terminated the Relationship
Table 17: Mean Satisfaction Ratings by Whether Shopper Patronized the Business Again
Table 18: T-Test Result for Overall Satisfaction by Those Reporting to Have Terminated the Relationship or Not
Table 19: T-Test Result for Mean Satisfaction Rating Versus Ever Having Patronized the Store Again
Table 20: Chi-Square Result for Satisfaction Ratings Versus Claiming to Have Maintained the Relationship or Not
Table 21: Chi-Square Result for Satisfaction Rating Distribution versus Having Patronized the Establishment Again