Abstract
One of the essential tenets of investment is a technical analysis of stocks. The process enables investors to determine the movement of prices in the stock market and identify the trends of trade. Moreover, technical analysis provides important information that can be used to make proper investment decisions (Aronson, 2007). This study is based on a technical analysis of Ford Motor Company, which is located in the U.S. The company trades in the New York stock market. The technical analysis of the organization’s stocks will embrace the three common methods outlined as follows:
Relative Strength Index (RSI)
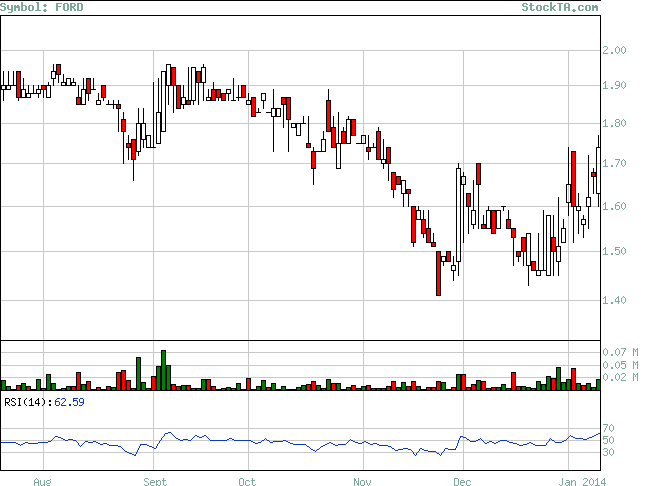
The relative strength index focuses on the magnitude and velocity of price changes. It is a momentum indicator that enables Ford Company to determine oversold and overbought instances of its stocks. RSI values in the market start from 0 to the highest figure of 100. For instance, if Ford is using the RSI any stock value at 70 is said to have reached the overbought level. In this case, the stocks may be overvalued despite the instances of a pullback. On the other hand, if the asset is marked at the level of 30 it may be undervalued or it may get oversold (Stock Technical Analysis, 2014). This information can be clearly clarified using the graph below.

From the graph shown above, the momentum of Ford’s stocks is derived from the ratio of positive price changes to the negative changes in price. At the bottom of the graph, it is evident that the company had an oversold of 30 and an overbought of 70. The neutral point is marked at 50. Any alerts will inform the organization on overbought and oversold by looking at the price movement from the neutral point (Park & Irwin, 2007).
Moving Average Convergence Divergence (MACD)
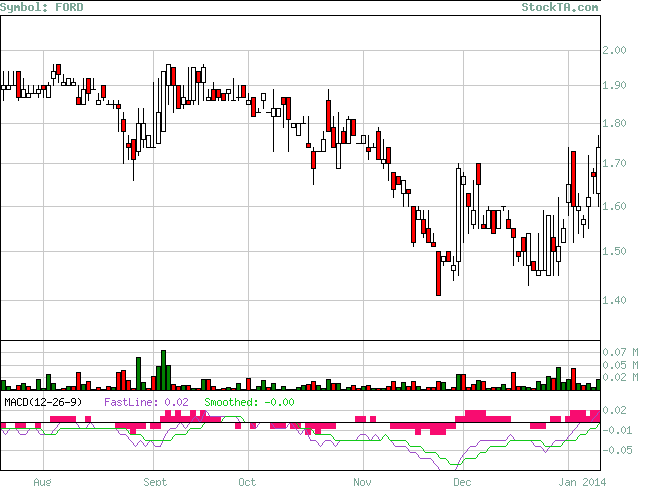
Moving average convergence divergence shows the average of moving prices of the organization’s stocks (Aronson, 2007). To calculate Ford’s MACD, it is essential to subtract 26-day EMA from the 12-day Exponential Moving Average. However, the signal line of the chart is derived from a 9-day EMA, which is plotted above the MACD. The signal line provides sell and buy signals. A clear analysis of the MACD must embrace three common concepts. One of the concepts is a dramatic rise, which occurs when the long term moving average moves away from the short term moving average (Stock Technical Analysis, 2014). Crossovers are bearish signals that occur when the signal line goes above the MACD. Divergence occurs when there is a divergence between security price and the MACD (Aronson, 2007). Ford’s MACD is indicated in the graph below.

From the graph, the Company’s MACD trends can be analyzed as follows:
- Short Term Intermediate-Term Long Term
- Tops top1 > top0 top2 > top1 top2 > top0
- Bottoms bottom0 > bottom1 bottom1 > bottom2 bottom0 > bottom2 (Stock Technical Analysis, 2014).
It is therefore evident that the organization has no MACD alerts for short term, intermediate, and long term periods. The values are zero for the three periods as indicated in the graph (Stock Technical Analysis, 2014).
A simple moving average (SMA)
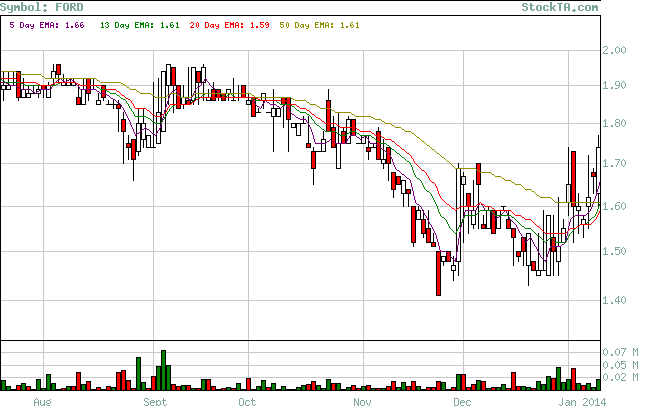
The simple moving average of the company is used to determine to change averages of prices. It is derived from the sum of the past prices for a given period divided by the total number of the prices (Westerhoff, 2005). The company’s SMA can be expressed as in the graph as shown.

From the graph shown above, the company’s moving average has been derived for a short term of 5 to 13 days, the intermediate period has been calculated from 20 days, and the long term period has been calculated from 50 days period. Alerts on prices will be received the bullish signals move above or below the 20 days period (Stock Technical Analysis, 2014).
References
Aronson, D. (2007). Evidence-based technical analysis: Applying the scientific method and statistical interference to trading signals. New York: John Wiley & Sons.
Park, C. & Irwin, H. (2007). What do we know about the profitability of technical analysis? Journal of Economic Survey, 21(4), 786-826.
Stock Technical Analysis. (2014). Ford moving average convergence divergence analysis. Web.
Westerhoff, F. (2005). Technical analysis based on price-volume signals and the power of trading breaks. International Journal of Theoretical and Applied finance, 9(2), 227-244.