Introduction
The outcome of a given genetic analysis relies on a cascade of events that commence from the extraction of genomic DNA, polymerase chain reaction (PCR), cloning of PCR products and plasmid isolation. Here, the sample DNA obtained from any source in very meager quantities can be made to meet the experiment requirements. This is accomplished by a technique known as PCR invented by Kary B. Mullis in the year 1988, whose main objective was to amplify and detect a target DNA molecule present only once in a sample of 10(5) cells (Saiki et al. 1988).It was proposed that in order to obtain good number of target copies, DNA needs to be denatured by a thermostable DNA polymerase isolated from Thermus aquaticus (Saiki et al. 1988).This would enable the amplification reaction to be performed at higher temperatures, significantly improve the specificity, yield, sensitivity, and length of products (Saiki et al. 1988).
For example, earlier workers have amplified up to 22 kb of the beta-globin gene cluster, 91 inserts of 9-23 kb from human genomic DNA and up to 42 kb from phaga lambda DNA (Cheng et al. 1994).It was further described that the ability to amplify DNA sequences of 10-40 kb will bring the speed and simplicity of PCR to genomic mapping, sequencing and would ensure studies in molecular genetics (Cheng et al. 1994). These research findings could serve as background information and may enable good number of investigations.
So, the study hypothesis in the present case was that the 18s rRNA gene and actin genes of fruit fly Drosophila melanogaster may be cloned and obtained as purified products that would correspond to the DNA ladder size. This is because it is not fully known whether this could be achieved in a simple academic laboratory setting. The process involved in this description was based on a flow chart commonly followed in molecular genetics experiments (Lab manual).
Therefore, the purpose of the present experiment is to determine the feasibility of molecular genetic analysis of18s rRNA gene and actin genes of fruit fly Drosophila melanogaster.
This organism has been extensively studied as a model due to its similarity to human beings in terms of development and behavior, and on the grounds that it could provide valuable insights in the genomic era (Beckingham et al. 2005).
Methods
Initially genomic DNA of D.melanogaster was isolated using the following steps.12 adult flies were added into clean 1.5 ml tubes and a 200µl of lysis buffer was then added. The flies were ground with a blue pestle mini-grinder for 5 minutes. The tubes were centrifuged for 1 minute at optimum speed in the microfuge.Care was taken to balance the weight while placing the tubes in the rotor (Lab manual).
The supernatant obtained on centrifugation was pipetted into a clean, labeled 1.5 ml tube and the original tubes containing the pellet were disposed into the biohazard bin. In the safety hood, a 200 µl of phenol/CHCL3 was added to the tubes containing the fly supernatant which are vortexed gently for 30 seconds. For an easy identification of clear phenol liquid, yellow colored anti-oxidant preservative was added. The tubes were again centrifuged for 2 minutes at maximum speed in the microfuge (Lab manual).
The aqueous phase obtained was transferred to a clean tube by using a pipet containing yellow tip. The clean tube with DNA samples was labeled as “DNA”. From this tube, a 5µl of DNA was pipetted into a new tube labelled”A”.A1µl of mg/ml RNase was added to the tube labeled “DNA”, which was vortexed and incubated for 30 minutes at room temperature. A 5µl of this RNase treated DNA was added to new tube labelled “B”. A 2µl of the DNA was pipetted from the tube labelled “DNA” to a new tube labeled ” Diluted” to which a 38µl of TE buffer was added and mixed gently (Lab manual).
The diluted DNA thus obtained was used for PCR.There were total 4 tubes labeled as “DNA”,”A”,”B”, and “Diluted”. The tubes “A” and “B” were used for agarose gel electrophoresis.A 1µl of gel loading buffer was added to tubes “A” and “B”. The samples thus obtained were loaded next to each other on a 1% agarose gel. One of the lanes of the gel was loaded with a sample of DNA ladder (Lab manual).
The subsequent reactions suitable for PCR were carried out in a 0.2 ml microcentrifuge tube which was labeled as “DNA”. A 2.5 µl of previously diluted DNA was added to this PCR tube followed by 47.5 µl of Master Mix that contains DNA template, 10x Taq polymerase buffer, a mix of 4 deoxynucleotides (dATP, dCTP, dGTP, dTTP), the forward and reverse primers and Taq polymerase. The total reaction volume maintained for PCR was 50 µl. The samples were kept on ice before loading into the PCR.A negative control was also prepared by adding 2.5 µl of previously diluted DNA to 2.5 µl of sterile water in the tube labeled “water”. The PCR was programmed for the initial denauration of template DNA at 94° for 3 minutes and for three main steps such as denaturation at 94° for 3 minutes, annealing at 52° for 1 minute and extension at 72° for 2 minutes (Lab manual).
The PCR was run for 4 hours and the samples were removed from the thermal cycler and stored in -20° C freezer. Next day, all the PCR samples were brought to room temperature by thawing. Here again, two new tubes labeled “DNA” and “water” were obtained to which 20 µl of PCR samples were added. A 2.5 µl of gel loading buffer was added to each tube and the samples thus obtained were loaded onto 1% agarose gel for carrying out eletrophoresis. A suitable DNA ladder was also loaded in one of the lanes of the gel. Electrophoresis was stopped when the blue dye was run half way down the gel (Lab manual).
The gel was finally photographed for observing the PCR product. Next, the amplified products i.e. the gene 18s rRNA + actin gene were inserted into plasmid vector pCR 2.1-TOPO using Nacl. Actually, 4 µl of PCR product was used for ligating into 1 µl of the vector using 1 µl of NaCl (Lab manual).
For this purpose, ligation reaction was made in a labeled 0.5 ml tube that was later tapped for mixing. It was incubated for 10 minutes during which it was thawed on ice to obtain top10 cells and labeled. In the next important transformation reaction, the vial containing the cells was added with 2 µl of ligation reaction and mixed gently, incubated for 30 minutes on ice and was kept in a heat block maintained at 42° C for 30 seconds (Lab manual).
The cell vial was again kept on ice for 1 minute. Later, a 250 µl of warmed SOC medium was added to the vial which was then kept for horizontal shaking for 1 hour at 37°C.The lab bench was cleaned with a counter cleaner to avoid any contamination. A 50 µl from the vial was spread on pre-warmed plates containing Leuria broth (LB) and LB+ Ampicilin. This is to check for the cells that would be either LB/amp- or LB/amp+ (Lab manual).
The next step was to observe the bacterial plates for transformation. With the help of a ruler, a 1 cm square was drawn on the agar side of plates. Number of colonies that appear within 1cm block were counted and recorded in a table for a comparison. The formula used here was area = πr2 and the total area of the plates was (3.14) (5 cm) 2 =78.5 cm2. Liquid broth of LB+Amp was prepared by adding 10 µl of 25 mg/ml Ampicillin to 5 ml LB broth (Lab manual).
From that mixture, 2 ml was transferred into 2 different tubes labeled as experimental E1 and E2. Two colonies were picked from the “experimental” LB +Amp plate with the help of a sterile inoculating loop. Care was taken to pick only colonies that appear clearly isolated from others. The colonies thus picked were placed separately into tubes containing 2 ml of LB +Amp liquid broth. They were grown overnight at 37° C kept on shaker and stored at 4° C till use (Lab manual).
In order to recover plasmid DNA (free from contamination of genomic DNA or protein) from the liquid culture and confirm the presence of the inserted DNA by restriction mapping Plasmid mini-preps were used. Initially, the 2 overnight cultures were obtained and 1.5 ml from each tube was transferred into two 1.5 ml mirofuge tubes which were again labeled as E1 and E2. They were centrifuged at 8000 rpm for 1 minute, supernatant obtained was collected into a beaker and the tubes were drained onto a paper towel (Lab manual).
The pellet was resuspended in 250 µl buffer P1 with RNase, by vortexing. A 250 µl buffer P2 was added and the tubes were inverted 4-6 times to ensure mixing. Vortexing was avoided to keep off shearing of genomic DNA. A 250 µl of buffer N3 was added and the tubes were inverted immediately 4-6 times (Lab manual).
To achieve a colorless solution, the solution was mixed thoroughly. Next, it was subjected to centrifugation for 10 minutes at full speed until a clear white pellet was visible. The supernatant was pipeted out and transferred to labeled Q1A prep spin columns that contain bottom tubes. They were again centrifuged at full speed for 1 minute, and the flow -through liquid in the bottom tubes was discarded. The spin columns were washed by 750 µl buffer PE, centrifuged for 1 minute at full speed (Lab manual).
The flow –through liquid was later discarded and again the column was centrifuged for 1 minute at full speed to remove any residual liquid from the column. The QIA prep column was placed in a clean labeled 1.5 ml microcentrifuge tube. DNA was eluted by adding 50 µl of sterile water to the center of each QIAprep column, allowing them to stand for 1 minute and centrifuging for 1 minute at full speed. The QIA prep columns were finally discarded (Lab manual).
The plasmid DNA thus obtained was subjected to electrophoresis. In a 1.5 ml tube,2 µl of plasmid DNA, 2 µl 10X loading dye and 16 µl distilled water were added. This sample mixture was loaded in adjacent lanes of a 1% agarose gel electrophoresis. The DNA ladder was loaded into one of the lines of the gel as a size marker. Electrophoresis was stopped when the blue dye front was run half way down the gel (Lab manual).
Results
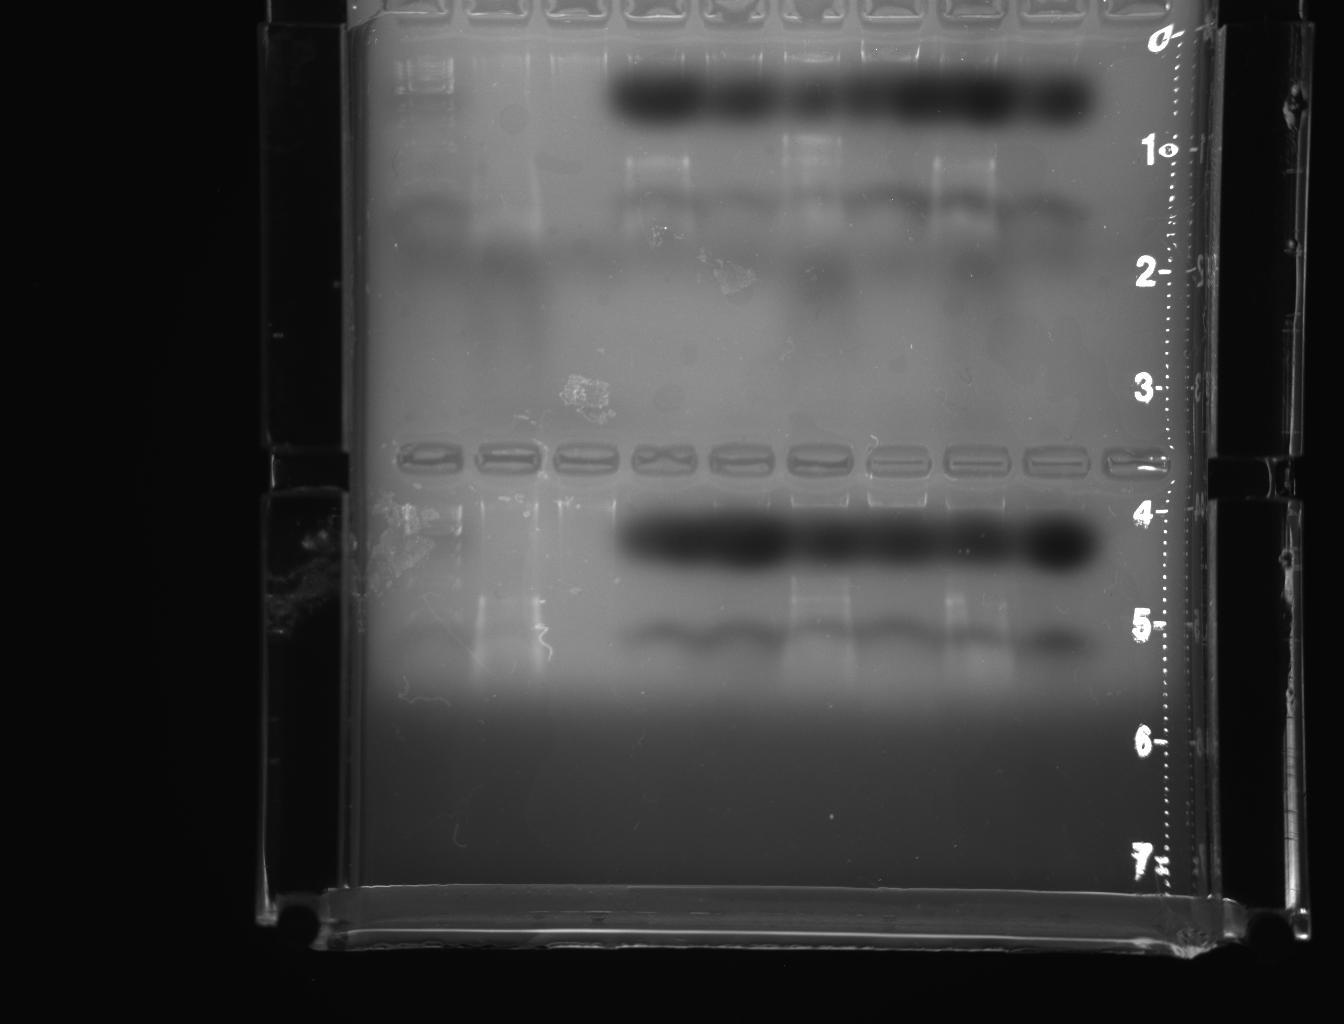
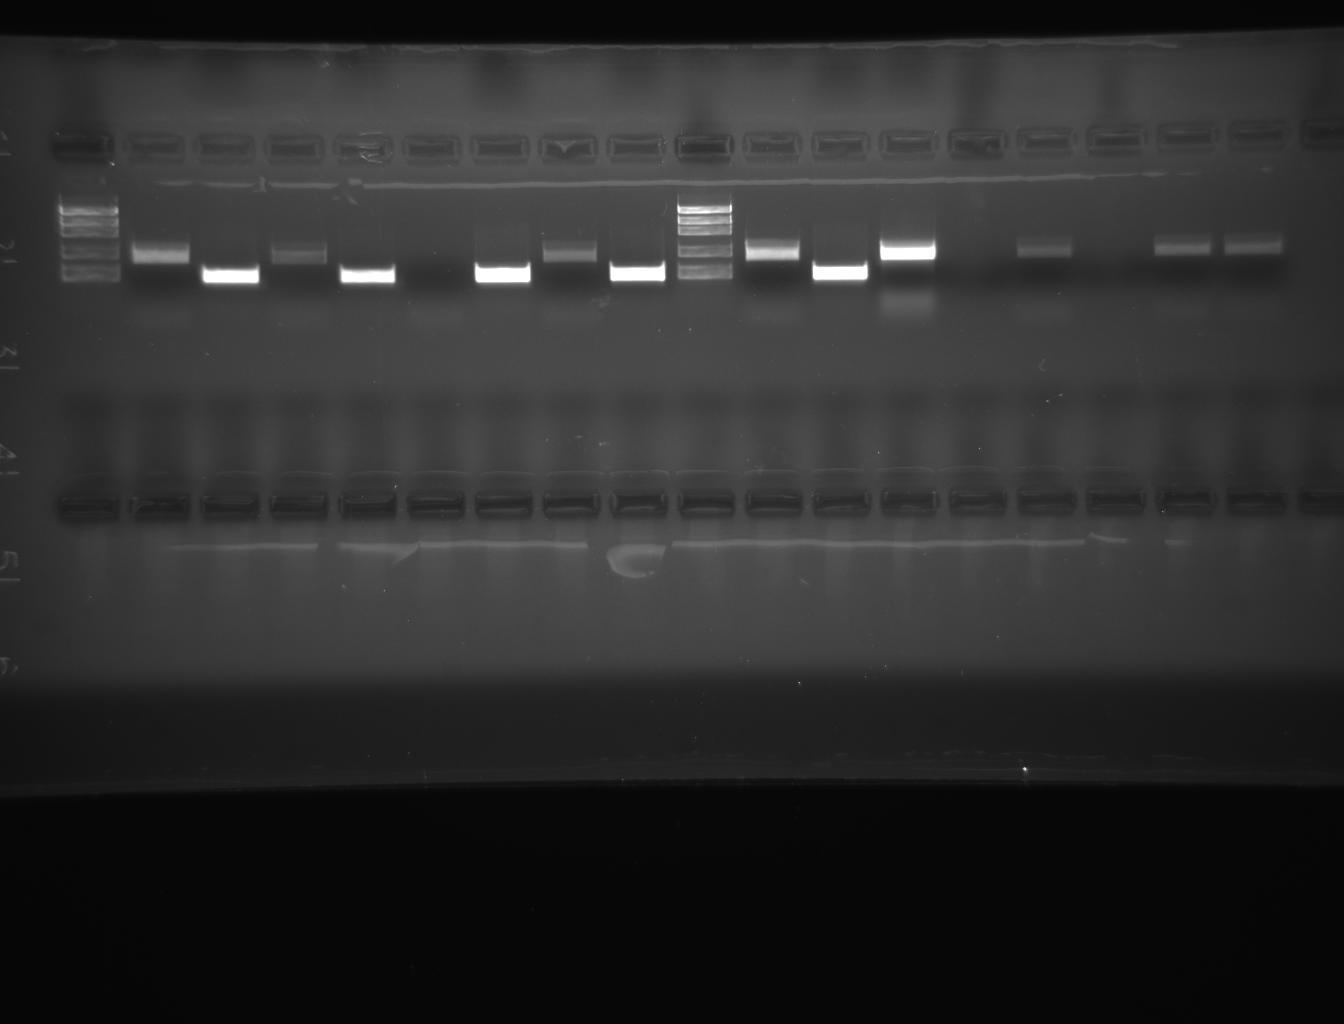
The results obtained were shown in the pictures 1 and 2.
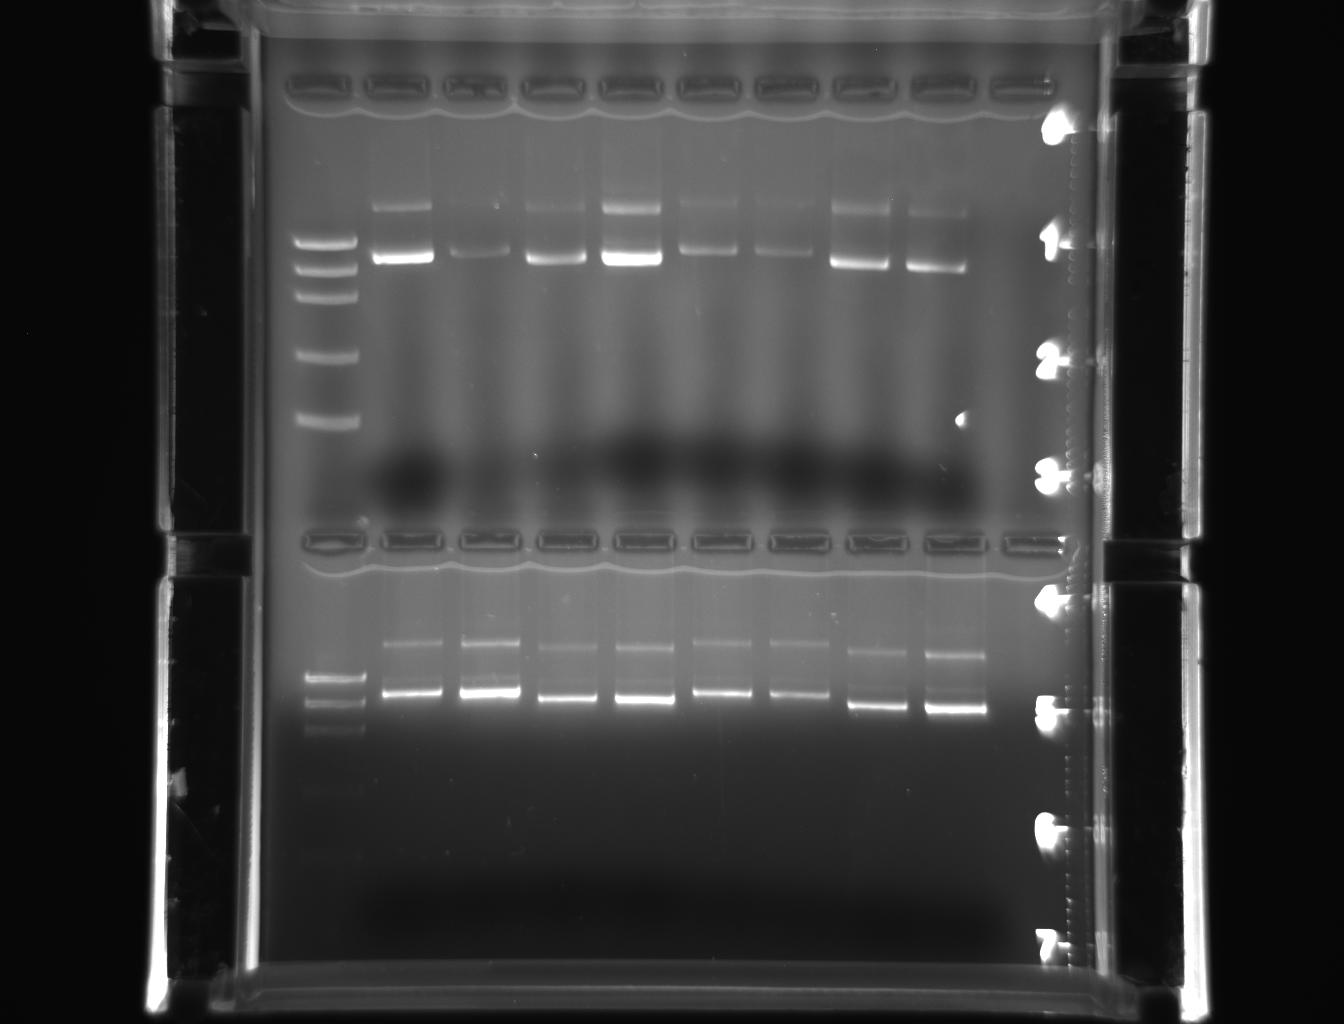
From left to right: ladder, 1E-e1, 1E-e2, 1W-e1, 1W-e2, 2E-e1, 2E-e2, 2W-e1, 2W-e2
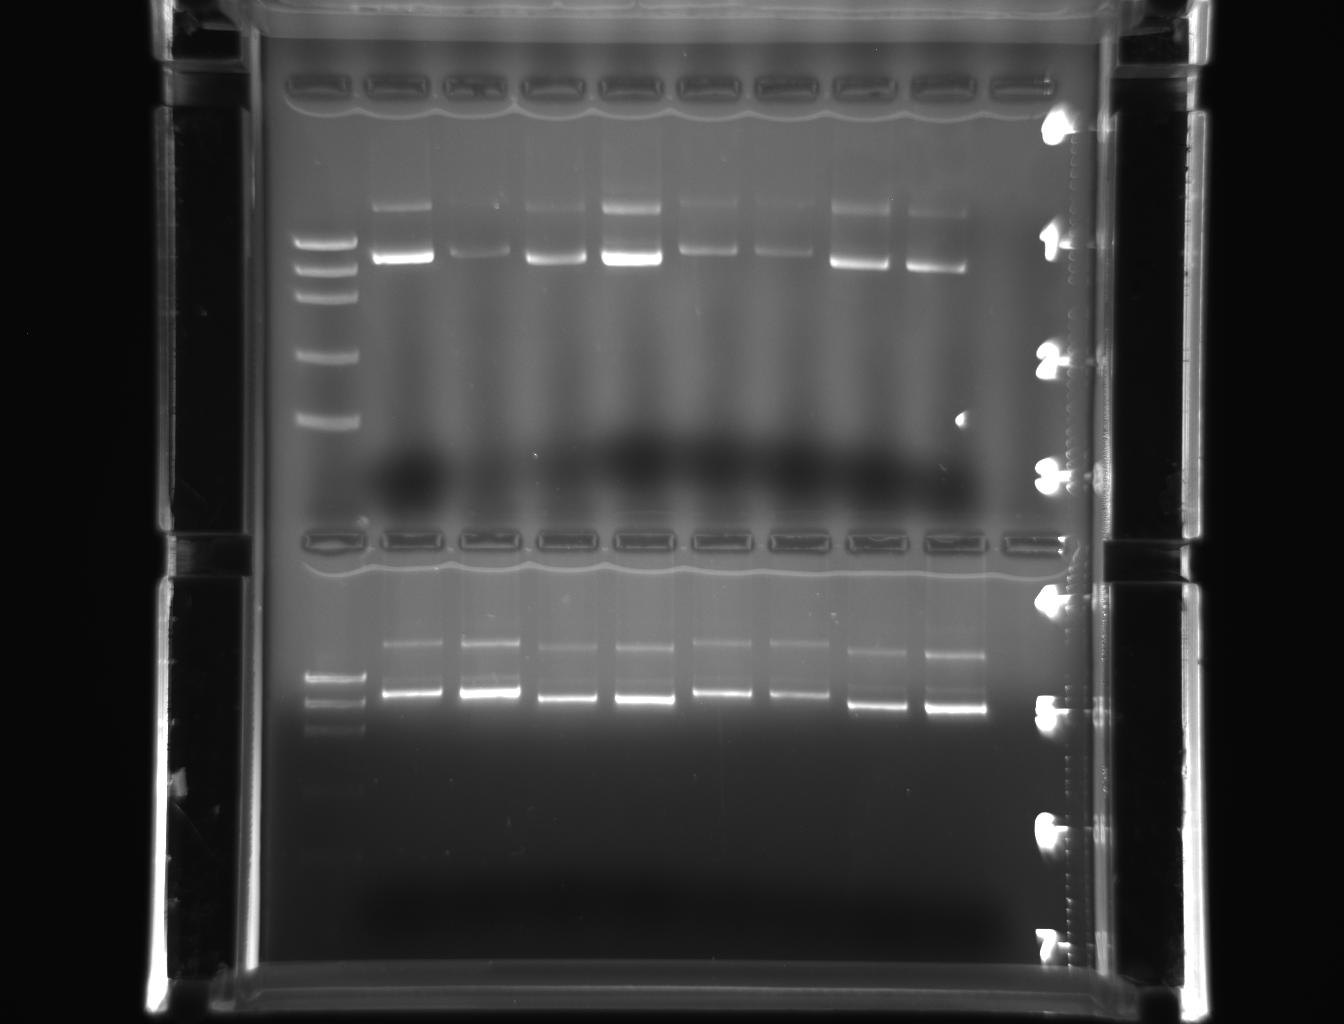
From left to right: ladder, 3E-e1, 3E-e2, 3W-e1, 3W-e2, 4E-e1, 4E-e2, 4W-e1, 4W-e2
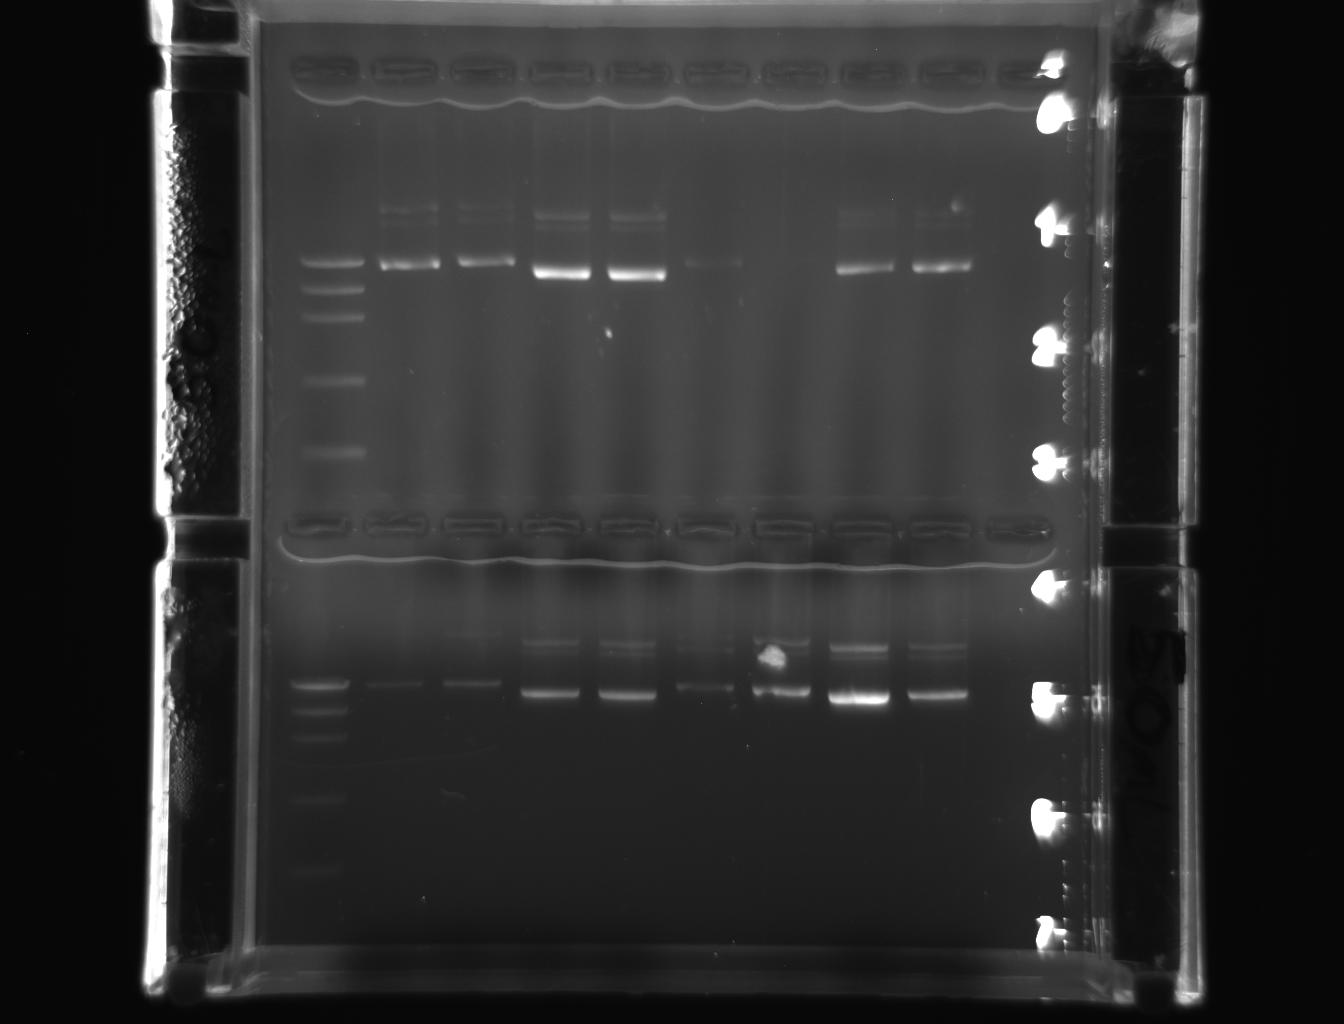
From left to right: ladder, 1E-e1, 1E-e2, 1W-e1, 1W-e2, 2E-e1, 2E-e2, 2W-e1, 2W-e2
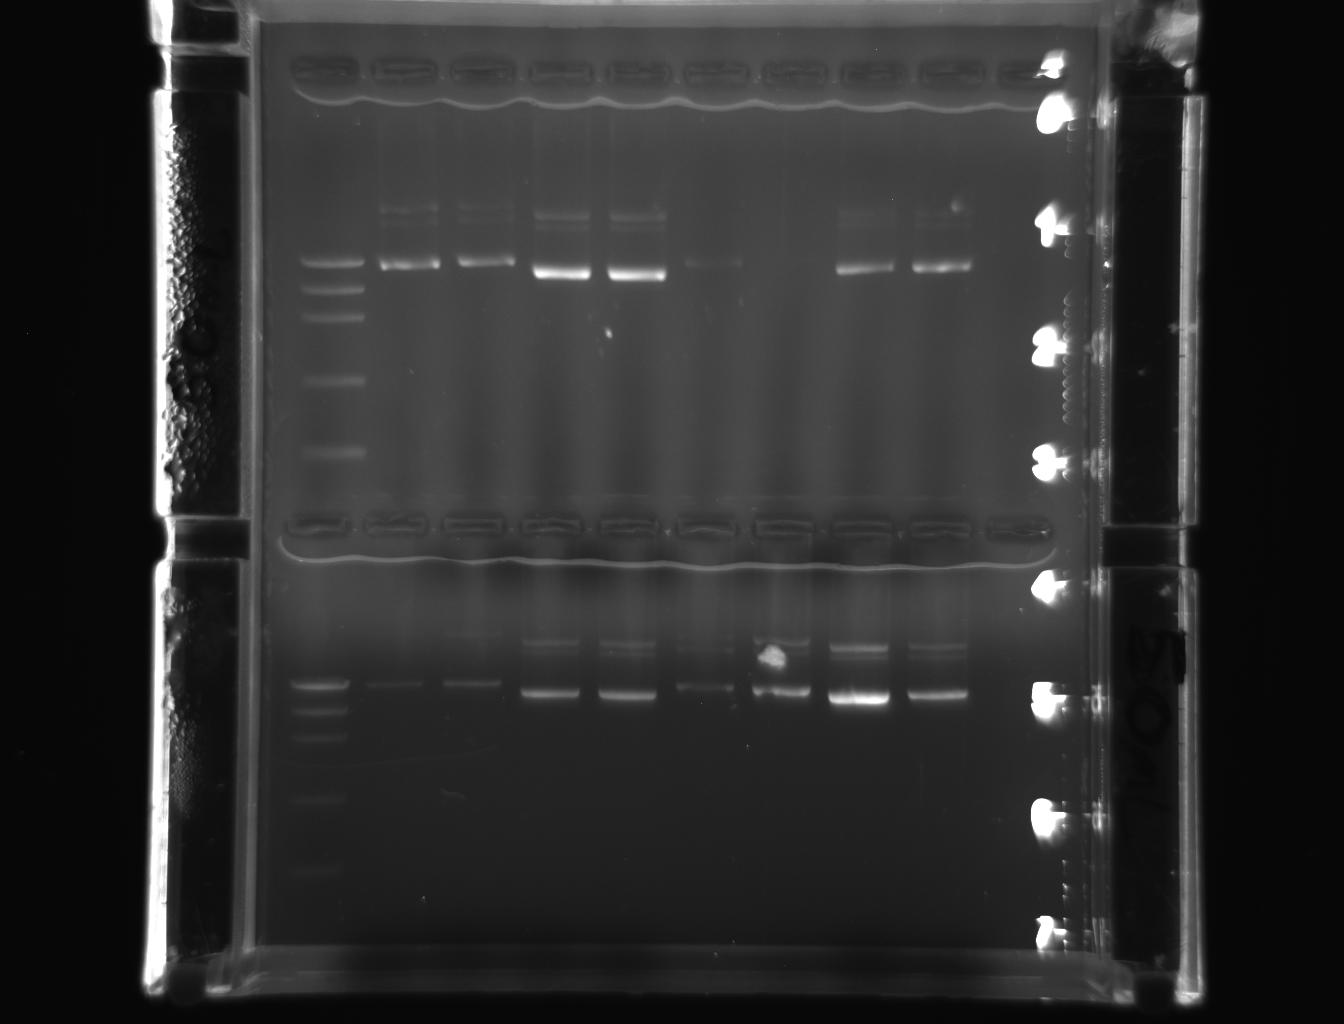
From left to right: ladder, 3E-e1, 3E-e2, 3W-e1, 3W-e2, 4E-e1, 4E-e2, 4W-e1, 4W-e2
In this experiment, genomic DNA was isolated from D.melanogaster and inserted into plasmid vector that was subsequently transformed into E.coli (Lab manual). The gel photograph of lab 6 (Picture.1) depicts the migration of samples “A” and “B” prior to amplification. The lanes of the gel ladder reflect the corresponding size of DNA in base pairs. The migration was moderate initially and later improved. When electrophoresis was stopped, DNA sample “A” was more prominent than the sample”B”. From the PCR experiment(Picture.2), it was revealed that, the amplified product of 18s ribosomal fragment was corresponding with the size of DNA marker at 5000 bp (Lab manual).
There was no amplification in the other lane due to the sample with no DNA and PCR mix. In other words, there was water instead of genomic DNA in the sample that was loaded. Hence, only clear dye front was visible clearly in that lane. The amplified product of actin gene has yielded similar results. In the transformation experiment, we have used control and transformation plates (Lab manual).
Control plates with LB would enable the growth of E.coli where as LB+amp would enable the growth of E.coli that are ampicillin resistant of that possess ampicillin resistant genes harbored in the plasmid vehicle used for transformation. So, LB plate would become positive control as it facilitated the growth of E.coli cells, in general, regardless of whether they ampicillin resistant genes or not. LB +amp plate would become negative control as it facilitates the growth of E.coli cells that are ampicillin resistant and deselects those that are ampicilin sensitive. As such, there would be obviously lot of difference in the cell growth anticipated in LB plate and LB+ ampicillin.
Hence, we observed a lustrous growth of colonies in the LB plate compared to the LB+ampicillin that has only 28 isolated colonies. From the miniprep experiment, we have isolated 50 µl of plasmid DNA and when it was electrophoresed bands similar to that obtained previously were observed.
But they were more conspicuous than the earlier PCR products indicating the purity of the miniprep product. The bands represented in pictures 3 & 4 were slightly above 5000 bp corresponding with DNA marker. The bands represented in the pictures 5 & 6 were also above above 5000 bp corresponding with DNA marker.
Discussion
In this experiement, an attempt was made to isolate, clone and purify18 s rRNA and actin genes specific to the common fruit fly (Lab manual). Firstly, the migration of DNA samples and their position in the gel according to the DNA ladder marker. may indicate their approximate molecular weight that was anticipated prior to PCR amplification. This could also reflect the reliability of the protocol such that it could be applied to other genomic experiments with minor modifications. Similarly, the amplified products obtained after PCR are in agreement with the DNA ladder size.
The use of LB medium and ampicillin played vital role in determining the presence of approiate colonies during transformation (Lab manual). This could decide whether the colonies with Amp resistant genes would be used for other advanced cloning and transformation experiments. This might also minimize the time required for the process of random selection of colonieMini prep experiment has enabled to obtain the plasmid DNA product in pure forms.
The pictures(3-5) depicted that the approximate band size of genes (18s rRNA and actin) cloned were greater than 5000 bp or close to 7500bp.Hence, the results obtained have addressed the hypothesis. The 18s rRNA gene and actin genes of Drosophila have been cloned ad purified with the simple protocol of laboratory manual. They have also been observed as amplified products, free from contamination, in the gel when the bands were similar to DNA marker, in molecular weight. Therefore, it may indicate that the stated hypothesis is correct. This could also indicate the efficacy of the reagents used and the conduciveness of lab atmosphere.
This lab work aimed at study hypothesis seems to be important; because of the growing interest on the study of Drosophila melanogaster as an animal model (Beckingham et al.2005).
Its potential genetic system has enabled the study of biogenesis of mitochondria that was considered to play essential role in cellular homeostasis (Fernandez-Moreno et al. 2007).This milestone may be due to the molecular analysis of wide range of gene/DNA inserts that has become easier with the feasibility of gene amplification process by PCR (Saiki et al. 1988). Therefore, the laboratory study of D.melanogaster should be greatly encouraged with more sophisticated molecular biology techniques, to come forward with more study hypotheses.
References
Beckingham, KM, Armstrong, JD, Texada, MJ, Munjaal, R, Baker, DA. “Drosophila melanogaster–the model organism of choice for the complex biology of multi-cellular organisms.” Gravit Space Biol Bull 18.2 (2005):17-29.
Cheng, S, Fockler, C, Barnes, WM, Higuchi, R. “Effective amplification of long targets from cloned inserts and human genomic DNA.” Proc Natl Acad Sci U S A 91.12 (1994): 5695-9.
Fernandez-Moreno, MA, Farr, CL, Kaguni, LS, Garesse, R.” Drosophila melanogaster as a model system to study mitochondrial biology.” Methods Mol Biol 372 (2007):33-49.
Saiki, RK, Gelfand, DH, Stoffel, S, Scharf, SJ, Higuchi, R, Horn, GT, Mullis, KB, Erlich, HA. “Primer-directed enzymatic amplification of DNA with a thermostable DNA polymerase.” Science 239.4839 (1988): 487-91.