Introduction
Finite element software is used to solve partial differential equations (PDE) and integral equations as well as in the pre and post-processing of finite element models. The process of finite element analysis was developed to help in solving composite problems associated with elasticity and plasticity in the field of engineering (Sallam 2009, p. 29). Finite element analysis (FEA) provides a thorough visualization of the locations of twists or bends in structures. It also helps in the identification of the distribution of stresses and displacements, which helps to reduce costs, materials and weight. The FEA software packages comprise multiple simulation options for regulating the density of modeling and evaluation of a system (Sallam 2009, p. 29). This paper looks into the uses of FEA software in embankments testing. The study uses 2D programs to perform two analyses: one during the construction phase and the other during the service stage.
Finite element analysis
Background
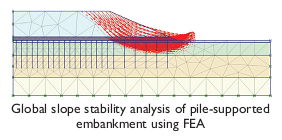
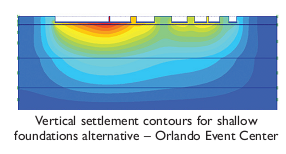
FEA has been used for over three decades, though its use in geotechnical engineering is new due to the complex nature of the field. The use of FEA in geotechnical engineering requires an engineer to have a wide range of skills including a proper background of soil mechanics and finite element theory, a thorough comprehension of various constitutive soil models, knowledge on operation of the software along with the experience in order to analyze the outcomes (Sallam 2009, p. 30). The lack of any of these skills can result in incorrect predictions. FEA is used in a wide range of geotechnical problems including settlement predictions, evaluation of axially and tangentially shafts, staged construction of embankments for highways and railroads, deep excavations in stages, and global slope stability for complicated geometries among others (Sallam 2009, p. 30).
Features of FEA
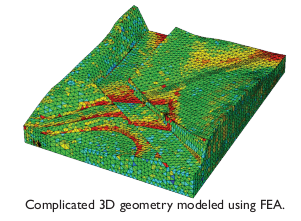
FEA can be used to model both 2D and 3D shapes. It can also be used to model slim structural and geotechnical members such as springs, struts, beams and plates. There are distinct elements used to model piles, and various types of analysis are available including plastic analysis, seepage analysis, Consolidation and Dynamic analysis. Another feature of FEA is the availability of advanced non-linear soil models such as Mohr Coulomb, Strain Hardening, Strain Softening and Linear Elastic (Bergado, Teerawattanasuk, Youwai, & Voottipruex 2000, p. 6).
Geotechnical calculations
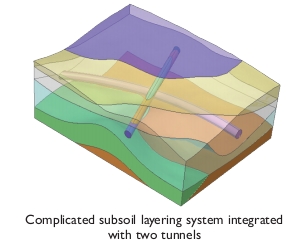
These calculations comprise stress-strain/load-deformation, time dependent deformations, water-soil interaction and soil-structure interaction among others. The approaches used in performing these calculations include classical solutions, empirical solutions and numerical solutions. Classical solutions are determined using assumptions that describe the phenomena under study (Bergado, Teerawattanasuk, Youwai, & Voottipruex 2000, p. 6). Empirical resolutions require the compilation of many field values and assessment of the consequent laboratory outcomes. Numerical solutions such as FEA allow the geotechnical engineer to reduce the assumptions in the study of soil behavior, subsoil layering systems and loading and boundary conditions (Bergado, Teerawattanasuk, Youwai, & Voottipruex 2000), p. 7.
Constitutive models for modeling soil behavior
There are soil constitutive models found in the FEA software packages. One of these is the Linear Elastic Model (LE). This model uses Hooke’s law of isotropic, linear elasticity to simulate soil behavior using two elastic parameters. The Mohr-Coulomb model (MC) is a first-order approximation model that uses five inputs. The third model is known as the Hardening Soil model (HS). It is used to model sand and clay among other things. Other models used in FEA include the Modified Cam Clay model (MCC), Soft Soil model (SS), Soft Soil Creep model (SSC) and User-defined models (Sarsby 2007, p. 305).
Case study
This paper looks at the application of FEA in the simulation of reinforced embankments on the soft clay soil of Bangkok. Previous research on analysis based on 2D plane strain indicated that the relation between reinforcement and backfill predominantly directed the reaction of reinforced embankments. This implied that the choice of FEA used was dependent on the permeability of the foundation. Previous uses of FEM, in the study of reinforced embankments on soft clay, showed that the phased construction of embankments on supple land could be modeled by FEA. This method was found to be appropriate due to the presence of large deformations and difference in the permeability of the foundation during consolidation (Tanchaisawat, Bergado, & Voottipruex 2008, p. 498).
Finite element analyses
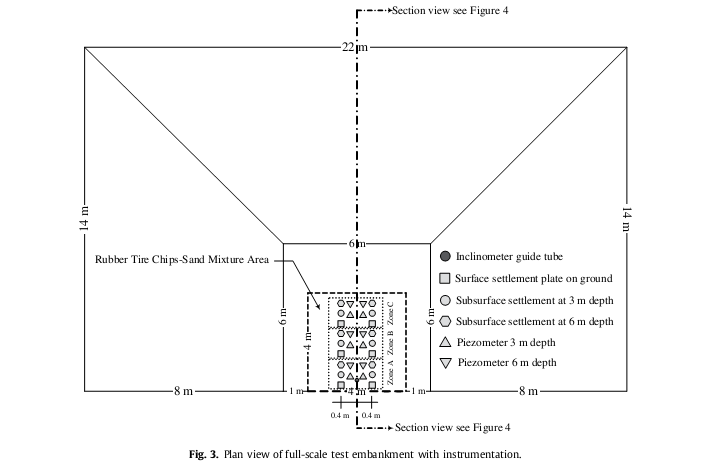
“Finite element was used to perform numerical modeling of the full-scale test embankment” (Sarsby 2007, p. 305). The process involved level surface tension and axisymmetric idealizations as well as modeling of the structure patterns. The embankment was modeled using 2D simulation, due to the reinforced trivial sand backfill situated in the centre of the embankment as shown in figure 5.
The finite element software used was determined to posses the right material properties in order to provide superior simulation. The software also provided the incremental fill to be simulated (Tanchaisawat, Bergado, & Voottipruex 2008, p. 499). The finite element mesh with 4000 nodes and 2500 elements is shown in figure 6.
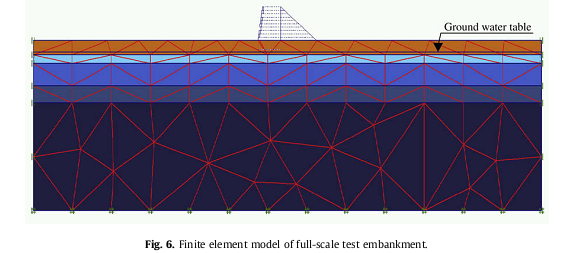
“The finite element mesh comprised six-node triangular elements for the fill and foundation soil, with the geogrid reinforcement and interface element using five-node line elements” (Tanchaisawat, Bergado, & Voottipruex 2008, p. 501).
Undrained analysis was used during the building process in order to model the progression. Drained analysis was later used after completion of the structure to model the strengthening stage.
The compressibility and strength characteristics of the soil are dependent on various factors. One of these factors is the over consolidation ratio, which affects the stability and production of surplus aperture pressures. Soil permeability has a similar reaction on the soil strengthening process (Tanchaisawat, Bergado, & Voottipruex 2008, p. 501).
Model parameters
The parameters used in the modelling include backfill material, weathered crust and soft clay. The material properties of these parameters are necessary for the FEM simulations (Basudhar, Dixit, Gharpure, & Deb 2008, 93). These properties include strength and modulus of elasticity as tabulated in table 1.

Results of the finite element and sensitivity analyses
Settlements
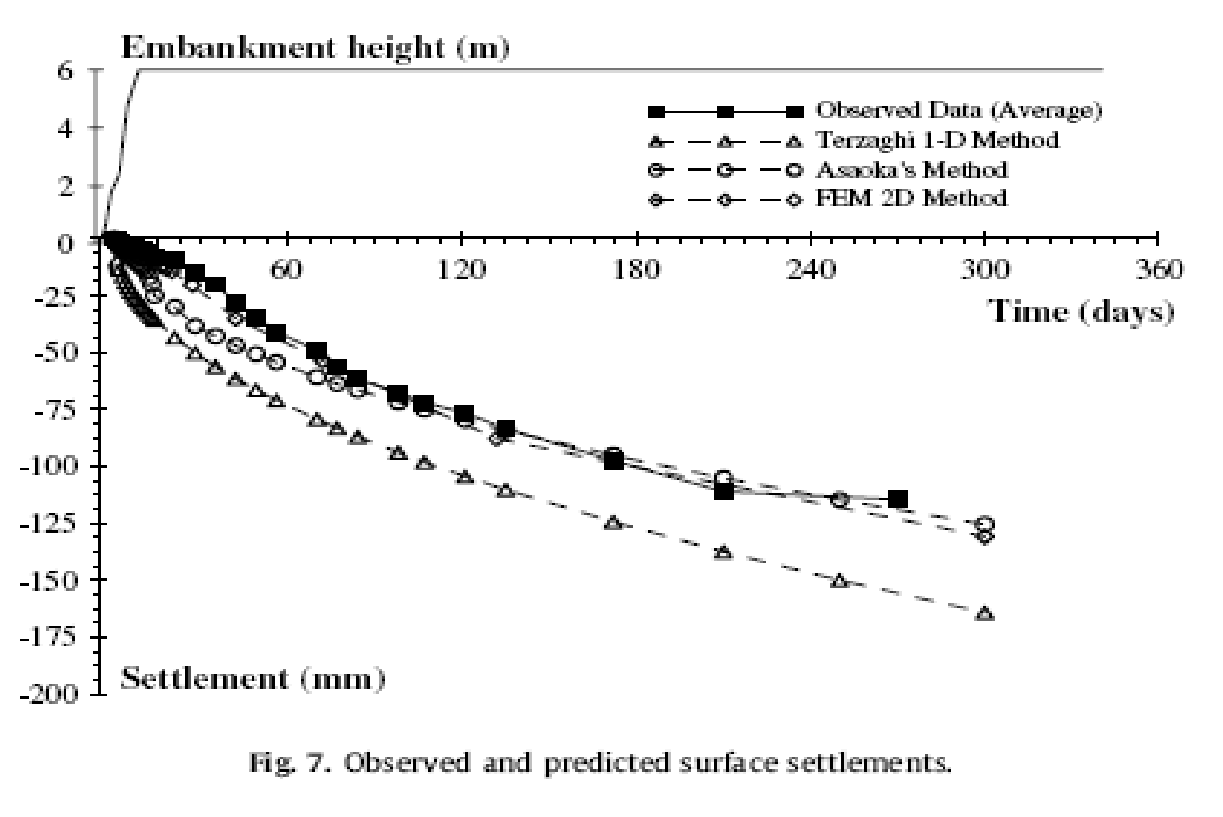
Settlement of the surface and sub surface was slow during the construction period, however, the rate increased after construction recording a maximum settlement of 122mm after 210 days of completion. The level of settlement along the cross-section of the embankment varies from the front at 122mm to the middle at 112mm and back at 104 mm. The time settlement curves of the test embankment were determined using the Asaoka (1987, p. 91) method, and were observed to agree with the results obtained from FEM analysis. An illustration of the results is shown in figure 7.
Excess pore water pressure
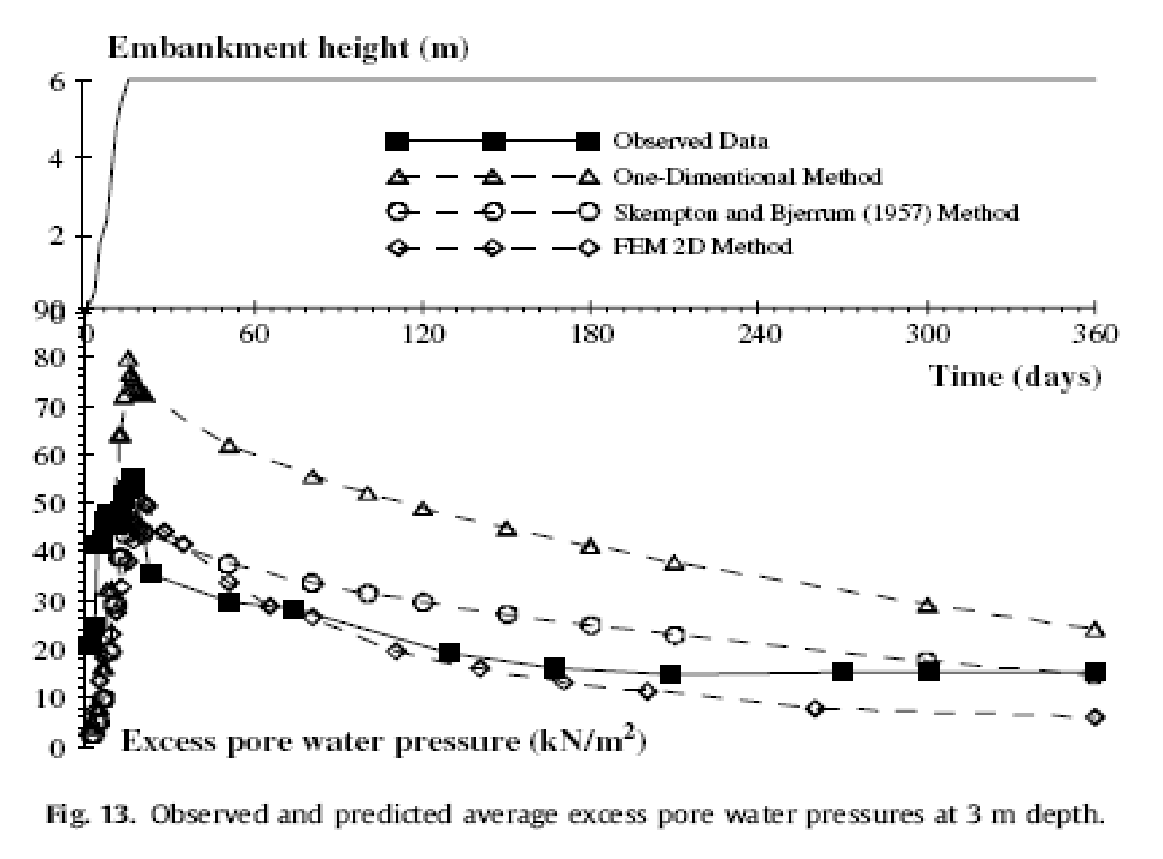
The pore water pressure was also determined at various depths using an open standpipe piezometer. The maximum pore water pressure was found to be at a depth of 3m, 15 days after construction was complete as shown in figure 8. The pressure at this time was 57kN/m2. After this period there was rapid dissipation of pore water pressure, before the pace reduced to a constant rate marking the end of consolidation (Asaoka 1978, p. 93). The results of excess pore water pressures obtained from FED 2D method were observed to be close to the observed data, though FEM computations showed further decrease in the rate of diminishing pore water pressure, unlike the constant decreasing rate measured. In addition to this, the computed figures for excess pore pressure were more than those measured. This was attributed to the low impact of lightweight material on the distribution of pressure at deeper depths. The finite element calculations required that the ground water table is specified. As a result, “the finite element software specified the pore pressure boundaries in the consolidation analysis as closed flow boundaries” (Asaoka 1978, p. 96).
Lateral wall movements
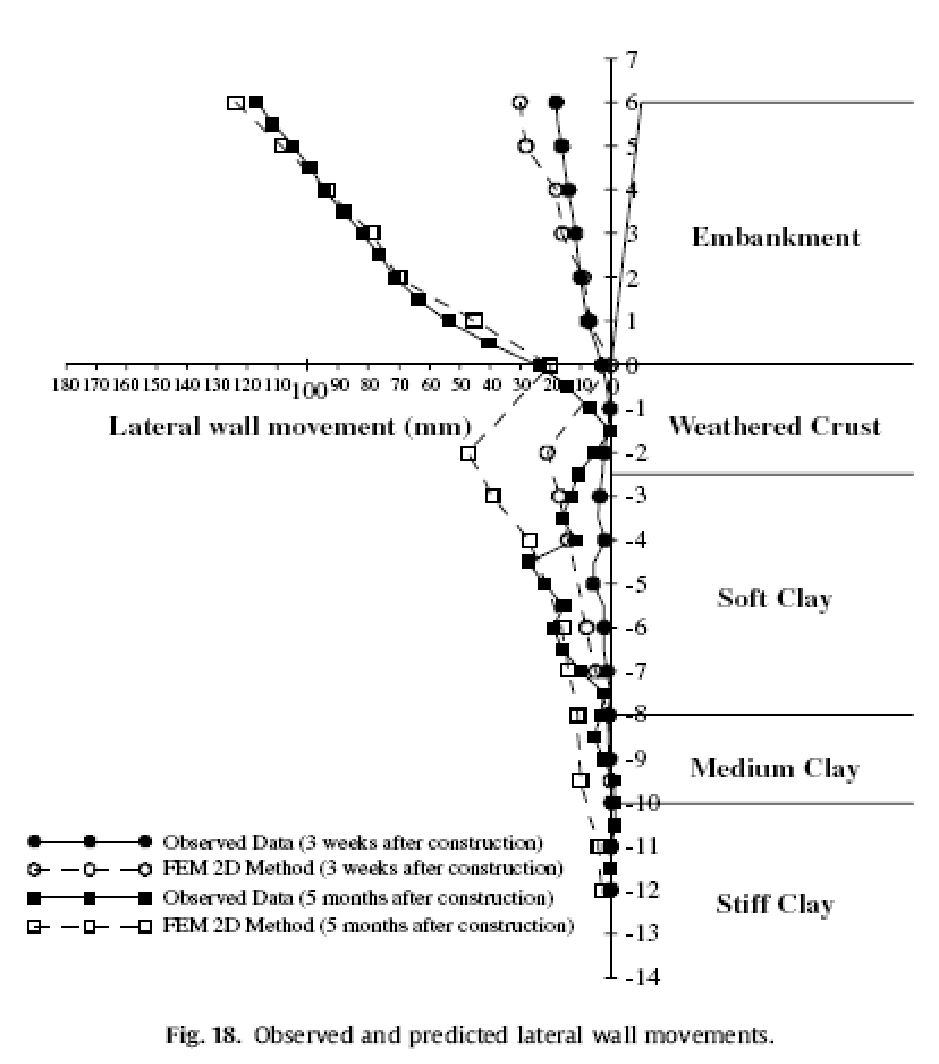
Lateral wall movement was measured close to the embankment facing using the digital inclinometer, which was installed from top of the embankment. It extended to a depth of around 12 m below the ground level in order to reach the stiff clay layer. Lateral movement was monitored for a period of 13 months after construction. A first, the interval for taking reading was weekly, but after the first month it was performed on a monthly basis. The maximum lateral movement was observed on the soft clay layer, which was situated about 5m below ground level. These observations were compared to the computations from the FEM results as indicated in figure 9. The lateral wall movements match the vertical settlements. As such, the moderately drained strengthening course at the initial phases of the building is not properly simulated by the undrained finite element analysis. It is also possible to over predict the lateral wall movement, due to the influence of the inclinometer casing stiffness, which causes reduced relative displacements between the surrounding soil and the casing. Other factors that cause a variation in the prediction include anisotropy, Poisson’s ratio and lack of uniformity. This explains the higher results obtained in the finite element analysis, than in the field observation (Tanchaisawat, Bergado, & Voottipruex 2008, p. 503).
Displacements in geogrid reinforcement
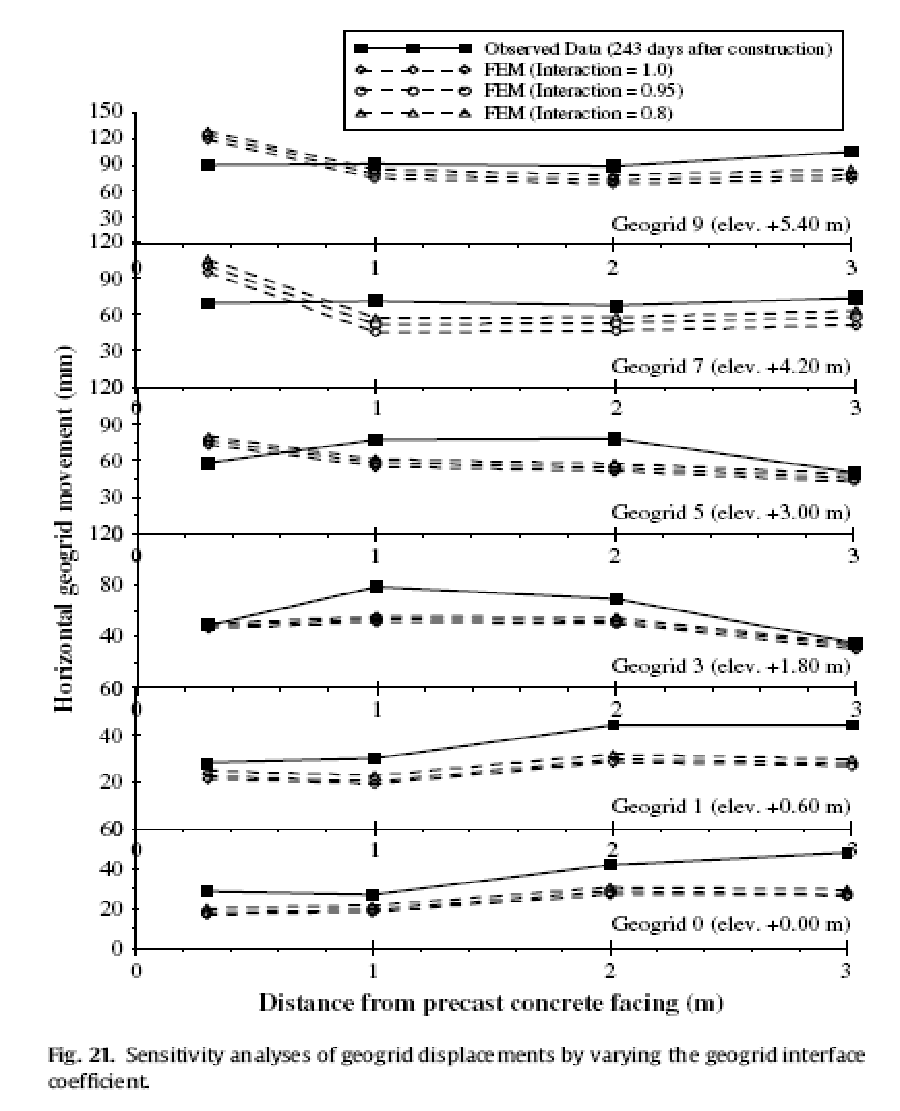
Readings were taken from the concrete facing, including 0.3, 1.0, 2 and 3 metres, from the onset of construction in conjunction with the lateral wall movement recordings. The recordings were taken for a period of 243 days after embankment construction, and compared to FEM simulations as shown in figure 10. The maximum recording was 100 mm, which matched the inclinometer reading of the lateral wall movement. The FEM values were noted to be smaller than the observed data, though the FEM values were higher at the points near the concrete facing due to its movement (Won & Kim 2007, p. 17).
Geogrid reinforcement tensions
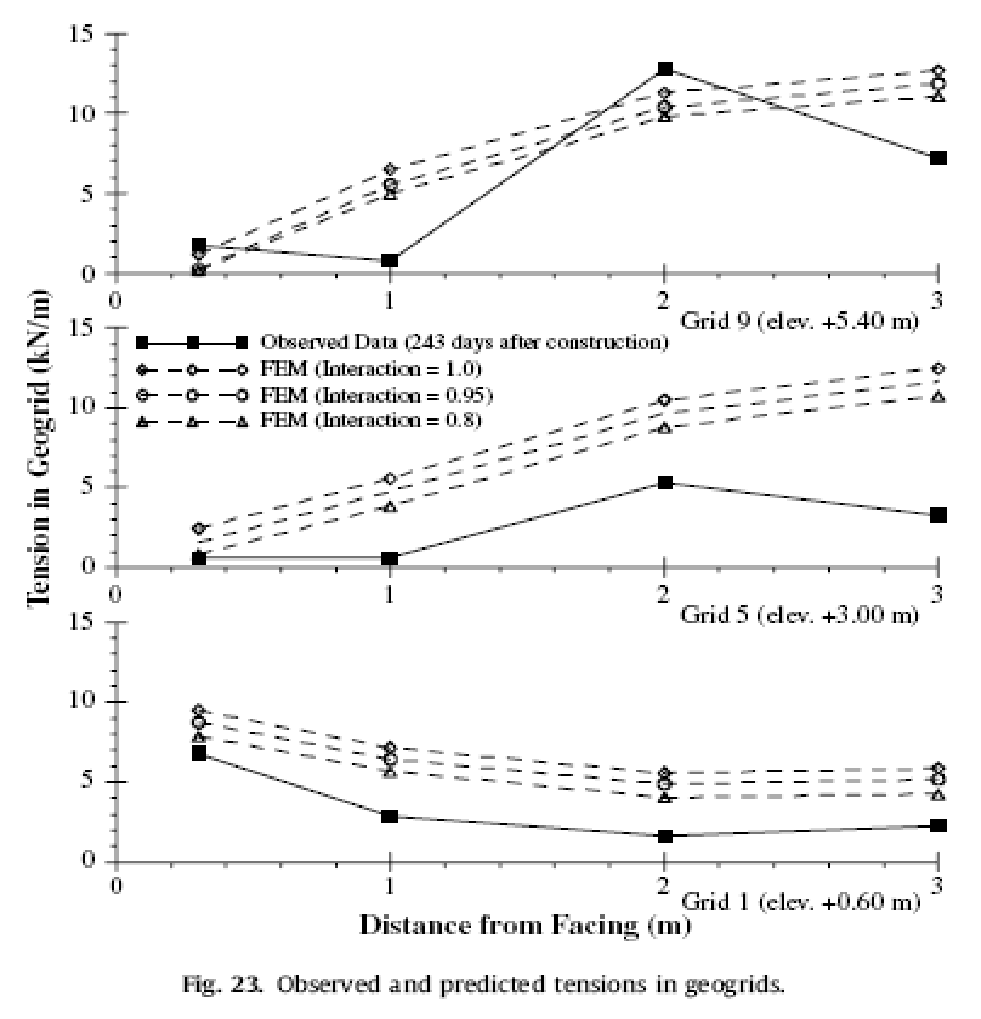
Strains in the longitudinal member of geogrids were measured using foil strain gauges, corresponding to zero tension in the reinforcements at the time of installation. Subsequent readings were taken as loads were added in the construction process. The strain gauges were installed at three layers of geogrid reinforcements situated at different elevations above the ground surface, at 60, 40 and 0 m. The recordings showed high tension at points near the face of the wall with the distribution of tension forces as shown in figure 11. FEM predictions and observed data were noted to be similar though the predictions were higher than observation data after the construction, due to the shortcoming of simulation during the consolidation process (Won & Kim 2007, p. 19).
Conclusion
The case study provided a suitable comparison of prediction from the Finite Element software and observations from the tests. Modelling deliberations in the FEM analysis comprised
“The method of applying the embankment loading during the construction process, the selection of an appropriate soil and reinforcement models, the estimation of soil permeability of the soft foundation, and the selection of appropriate parameters at the interface between the lightweight tire chips-sand backfill and the geogrid reinforcement corresponding to the interaction mechanism” (Tanchaisawat, Bergado, & Voottipruex 2008, p. 511).
The calculated outcomes were identified to be in concurrence with the measured data. Though there were minimal deviations, the finite element software was noted to be a fast way to provide predictions in geotechnical engineering.
Reference list
Asaoka, A 1978, Observation procedure of settlement prediction, Soils and Foundations, vol. 18, no. 4, pp. 87–101.
Basudhar, P, Dixit, P, Gharpure, A, & Deb, K 2008, Finite element analysis of geotextile-reinforced sand-bed subjected to strip loading, Geotextiles and Geomembranes, vol. 26, no. 1, pp. 91–99.
Bergado, D, Teerawattanasuk, C, Youwai, S, & Voottipruex, P 2000, FE modeling of hexagonal wire reinforced embankment on soft clay. Canadian Geotechnical Journal, vol. 37, no. 6, pp. 1–18.
Sallam, A 2009, Application of Finite Element Analysis in Geotechnical Engineering, Florida Engineeringsociety, pp. 29-31.
Sarsby, R 2007, Use of ‘Limited Life Geotextiles’ (LLGs) for basal reinforcement of embankments built on soft clay, Geotextiles and Geomembranes, vol. 25, no. 5, pp. 302–310.
Tanchaisawat, T, Bergado, DT & Voottipruex, P 2008, Numerical simulation and sensitivity analyses of full-scale test embankment with reinforced lightweight geomaterials on soft Bangkok clay, Geotextiles and Geomembranes, vol. 26, pp. 498–511.
Won, M, & Kim, Y 2007, Internal deformation behavior of geosynthetic reinforced soil walls, Geotextiles and Geomembranes, vol. 25, no. 1, pp. 10–22.