Presentation of economic data for three countries(Australia, China, and Greece ) in charts
Economic data refers to statistics for variables that are the key indicators or determinants of economic growth. The following charts represents the economic data for Australia, China, and Greece.
Both of these three countries have experienced global financial crisis (GFC) which destroyed many countries’ economy as a result of inflation. The charts below are illustrated as per the data obtained between 1999 up to 2012, being the most recent one.
Interest rates
- Australia interest rate
- China interest rate
- Greece interest rate
GDP
- China GDP
- Australia GDP
- Greece GDP
Annual GDP growth rate
- Australia annual GDP growth rate
- China Annual GDP growth rate
- Greece annual GDP growth rate
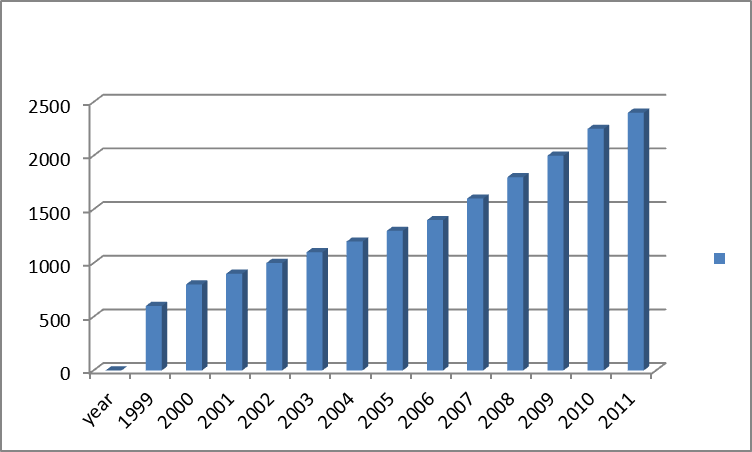
GDP per capita
- Australia GDP per cap
- Greece GDP per capita
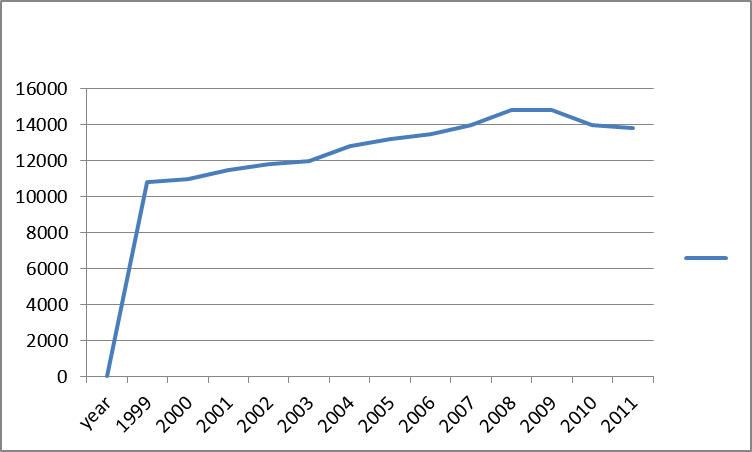
- China GDP per capita
Government budget
- Australia Government Budget
- Greece Government budget
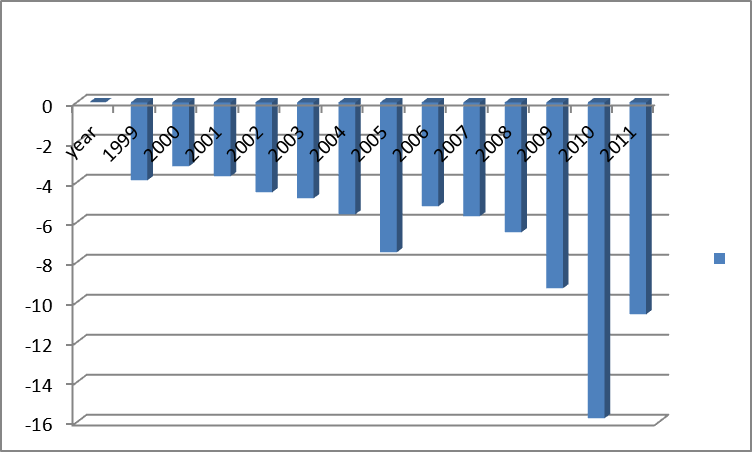
- China government budgeting
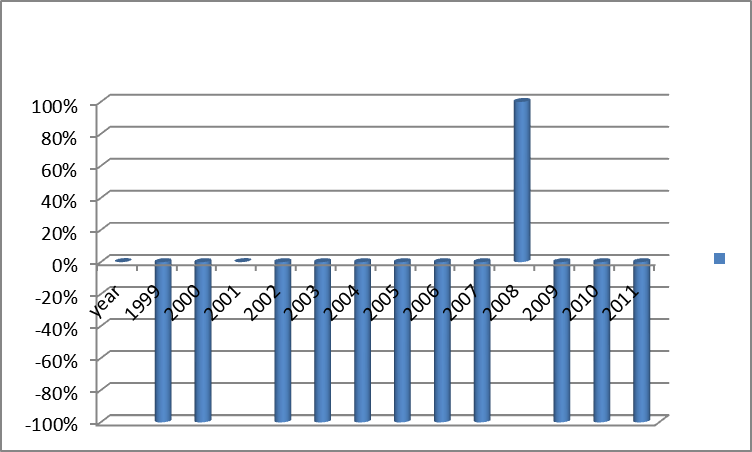
Unemployment rate
- Greece unemployment rate
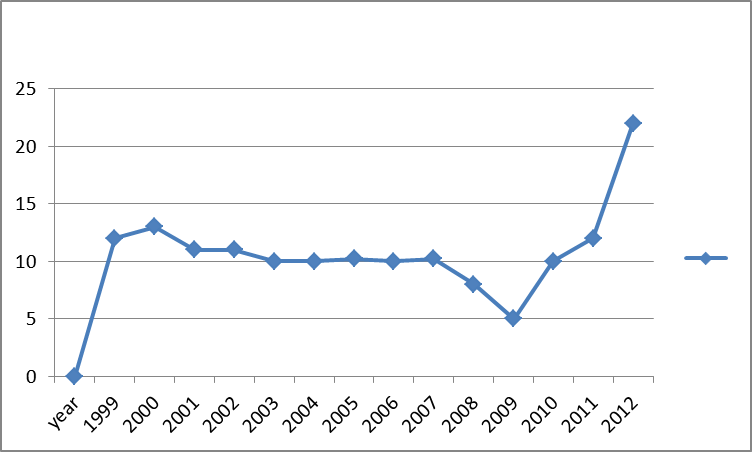
- Unemployment rate in Australia
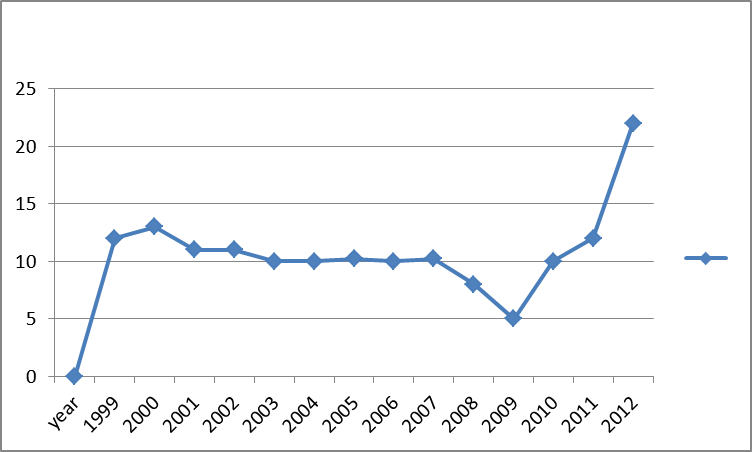
- China unemployment rate
Inflation rates
- China inflation rate
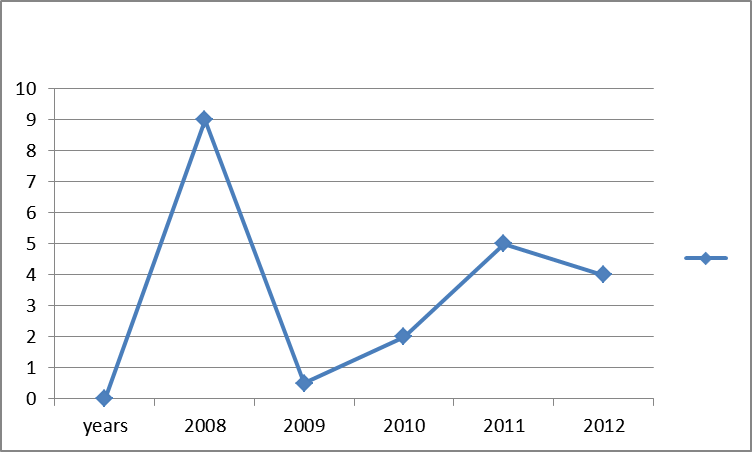
- Greece inflation rate
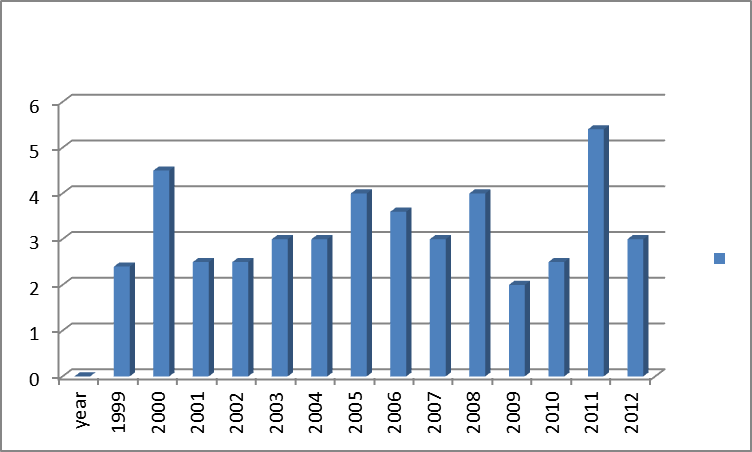
- Australia inflation rate
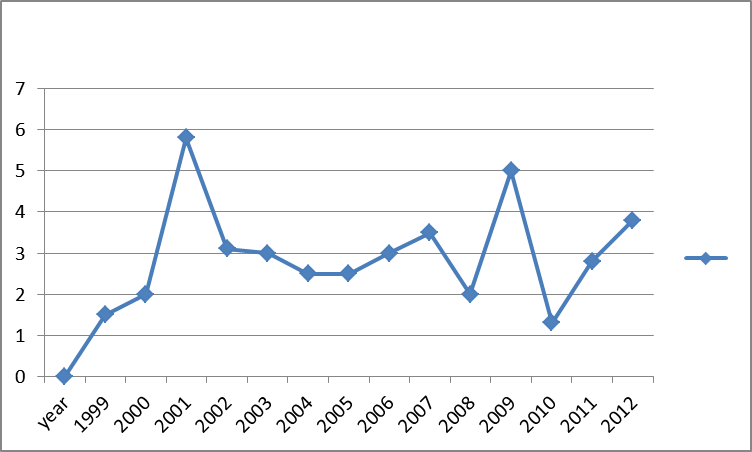
Comparison of the economic data in charts for each three countries
The comparison of the three countries based on the data above shows that all countries, since 1999 have experienced an increase of their GDPs proportionately up to date. The countries of Greece and Australia have experienced proportionate increases until 2009 when they started to decrease. On the other hand, China experienced growth throughout this period under study.
When it comes to inflation, Australia’s inflation rate was high at the beginning of the period, but due to control measures that were put in place to deal with this skyrocketing rate, it reduced significantly (Gary 2009). As for China’s case, there was boom and recession showing times in which the country was facing inflation that affected its economy negatively.
Unemployment rates for the three countries show a rise in job at the end and a decrease at the middle of the period. As for China and Australia, there was frequent fluctuation of the rates but for Greece the rates started from a higher level before they decreased and finally, they returned to high levels.
It’s worth noting that the interest rates for China and Australia were fluctuating from the beginning due to changes in the economy brought by factors like global financial crisis (Taylor 2008).
This indicated some decreases at the end in both of the countries justifying the presence of challenges towards the lapse of the period. There is much of increase of GDP per capita in each country as shown in the charts above. The real GDP growth rate is fluctuating in both countries from the beginning but with an increase at the end.
The budgetary position for Australia and Greece has been increasing from 1999 up to 2009 when the GFC occurred making the governments of these countries to reduce national expenditure and increase taxation to curb the challenges in the market and control money in the hands of the public (in circulation).
These changes in their budgetary decision was due to the situation of the economic crisis that demanded efficient control measures to prevent the economy from further collapse
How the GFC has influenced the economies of China, Australia and Greece
Global Financial Crisis (GFC) refers to a situation whereby most countries worldwide face challenges in form of loss of value for money due to inflation. This results because of the presence of much money in circulation or lack of money leading to increment of prices of goods and services, resulting to starvation.
The common public are unable to budget properly for their expenditure because the value of their money is lost as they pay a lot for less service. The price fluctuation is the key contributor to unbalanced financial economy.
Some people have defined GFC as a combination of shocks and increase in risks to all markets worldwide, which creates tension to households and investors. Thus, the future of the economy is determined by the form of the crisis (whether permanent or temporary).
The GFC causes a variety of effects to economic variables, which in turn influence the performance of financial markets. GFC is believed to cause economic contraction in global trade and production. This explains why you find that the trade activities reduce while the GDP may still be high because companies are still engaging in production.
This crisis also has a risk of ceasing interbank lending, hence leading to increase of interest rates to a point whereby it may not be economical for them to engage in any transaction. Due to contraction of trade, the prices of commodities offered increases leading to a rising inflation rate and vice versa.
This may prompt a government to respond to this situation by coming up with fiscal and monetary policies to control inflation in the economy. Monetary policies involve increasing the borrowing for commercial banks from the reserve bank so that these entities may extend the same to the public (customer) to discourage loans.
On the other hand, the fiscal policies involve government increasing their tax rates especially on luxurious commodities to discourage expenditure that increases money in circulation. These control measures (fiscal and monetary policies) adopted by the government to deal with inflation in turn affect the activities and flow of financial trade leading to unemployment in time of deep recession.
This has been one of the major effects that have been emerging leaving many citizens unemployed. Hence, such situations call for government to intervene maybe by use of subsidizing programs to improve the situation.
The following is information on the effects of GFC to economic variables as discussed in tables presented above. The trade reduced, while the production increased leading to increase in real GDP. In the year 2011, Australia’s real GDP increased by 0.8% resulting to a fall in trade by 4.7% which in turn influenced a drop in real GDP per capita.
The presence of a deep recession resulted to an increase in unemployment rate leaving many people without jobs, since the trading activities got reduced and many industries started to close down because the cost of production was rising at a high rate. Once the trading activities get reduced, the real GDP per capita decreases and the annual real GDP growth increase (Frank 2001).
As for the case of Australia and Greece, their government expenditure must be reduced significantly in order to reduce the amount of money in circulation. In addition, the taxes must be increased in order to collect money back from the public to help in reducing inflation.
The effects of the GFC in each country may differ due to factors such as control measures involved, its status in terms of whether it’s permanent or temporary (Eisenberg 2002).
Financial crisis in 2009 led to many problems in Australia in leading to inflation, increase interest rate, and decrease in GDP per capita thus influencing government to intervene by reducing their expenditure and improving taxes to control a lot of money in circulation.
AE diagrams to analyse and contrast the macroeconomic behaviour of Greece and Australia
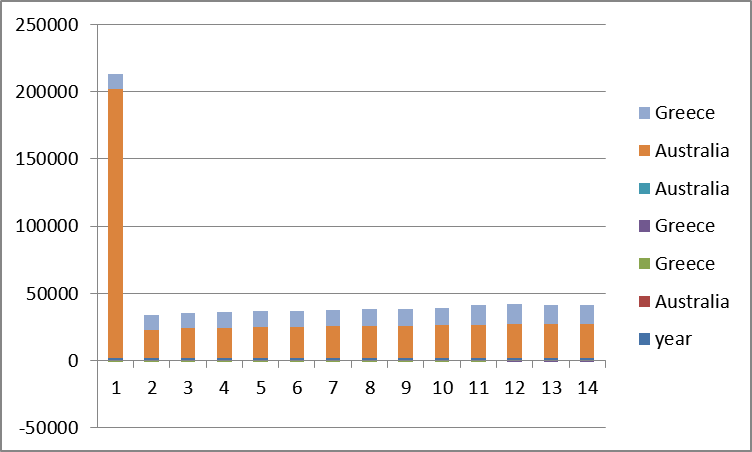
The differences for the AE diagrams is brought by the number of factors some including, population whereby Australia has large population than Greece hence leading to unemployment and inflation to rise. This population also exerts pressure on the available resources including labour and capital necessitating the government to create additional jobs (Smith 2006).
On the other hand, Australia encourages the use of innovation thus leading to many companies coming up with appropriate measures to curb the unemployment situation so as to improve the lifestyles of the country’s population.
World economic depletion since 2008 during the GFC which almost affected all the countries left Greece in a problem up to date. This inflation made the prices to increase causing the goods and services to be unaffordable to most of the Greece citizens.
The difference in government policy is another factor to consider. Every country has its own policy and ways of dealing with economic situations therefore bringing about the differences in the AE diagrams. These policies are usual passed by those in the legislative system and hence, one cannot expect different countries to pass the same policies.
The stages that these countries undergo in economic development are other sources of differences, since countries are in different stages of development (Adams 2000). For instance, Australia is more developed than Greece and this is reflected in the EA diagram below.
AE diagram illustrating Australia and Greece economic data
From the above information, china is one of the countries that have been known for having the greatest change or rise in economy though it has a very large number of people.
Greece economy declined from the 2008 during GFC in Europe and up to date it‘s not doing well compared to the rest (China and Australia). Australia is a medium class country whereby the government ensures creation of jobs to discourage unemployment (McGrath 2005).
References List
Adams, Y 2000, Economics: Emerging Economies, Yale University Press: New Haven.
Eisenberg, K & Melvin A, 2002, Economics: Economic Growth, The BarBri Group: Chicago.
Frank, S 2001, Business Studies: Gross Domestic Product, McGraw/Irwin: Homewood.
Gary, S 2009, Business and Economics: Economic Growth Factors, Cavendish: New York.
McGrath, T 2005, Business and Government, Cima Publishing: Boston.
Smith, J 2006, Business studies: Economic data, Sweet and Maxwell: London.
Taylor, H 2008, Economics Studies: Inflation Rate, Harvard Business Review: Boston.