Introduction
Background to the economic performance and development in Guatemala since colonial period
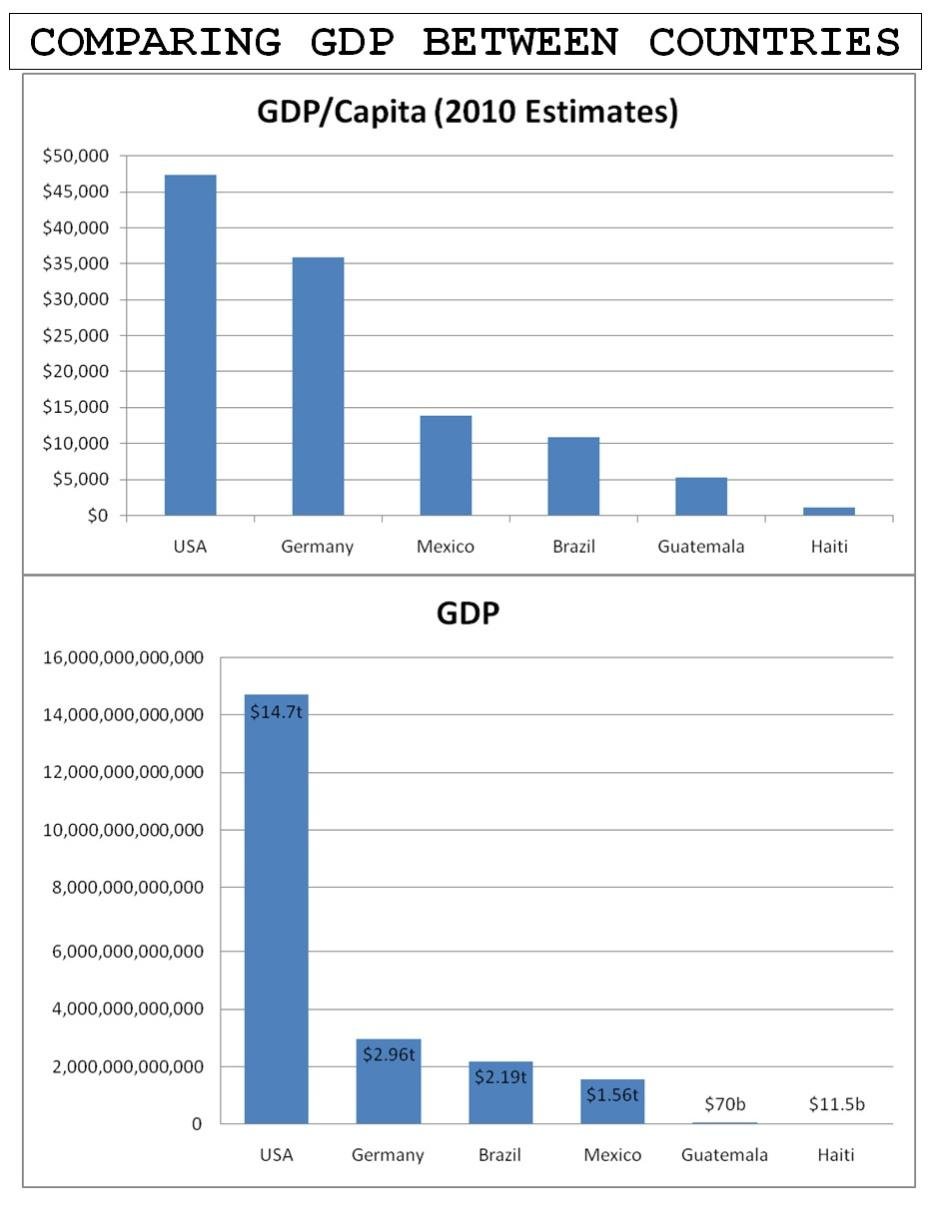
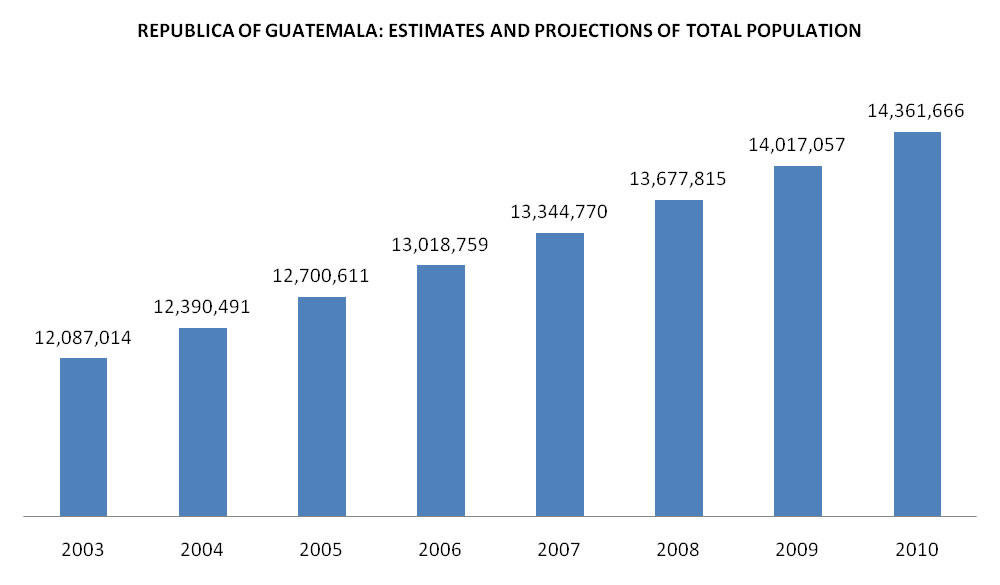
The state of Guatemala is the most populous country in the Central American region, with an estimated population of about 13.39 million people. As of 2013, the country’s Gross Domestic Product per capita is estimated to be one-half that of an average for the Caribbean and Latin American nations (Krznaric 114).
Since the country was first invaded and colonized by the Spanish, it has largely remained an agricultural economy, with current statistics indicating that the agricultural sector accounts for more than 13% of the GDP and about 40% of the total labor force (Benería 53). In fact, the country heavily relies on agricultural export, mainly on such products as sugar, coffee, bananas as well as vegetables. The high level of poverty among the native people has been a major challenge for the economy since it gained independence from Spain.
The Spanish colonialists exported massive volumes of indigo and cochineal. However, with the invention of synthetic dyes, these two products lost their world market, thus ceased to be the country’s chief exports. For the better part of the 19th and 20th centuries, the country heavily depended on cocoa and oil as the chief exports to fill the export void. By the end of the 20th century, Guatemala’s economy was the largest in Central America (Benería 53).
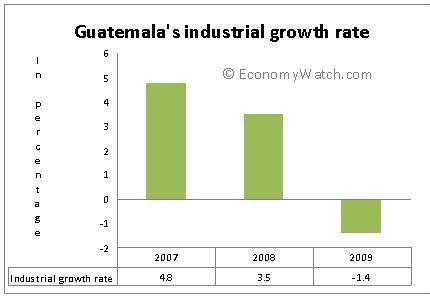
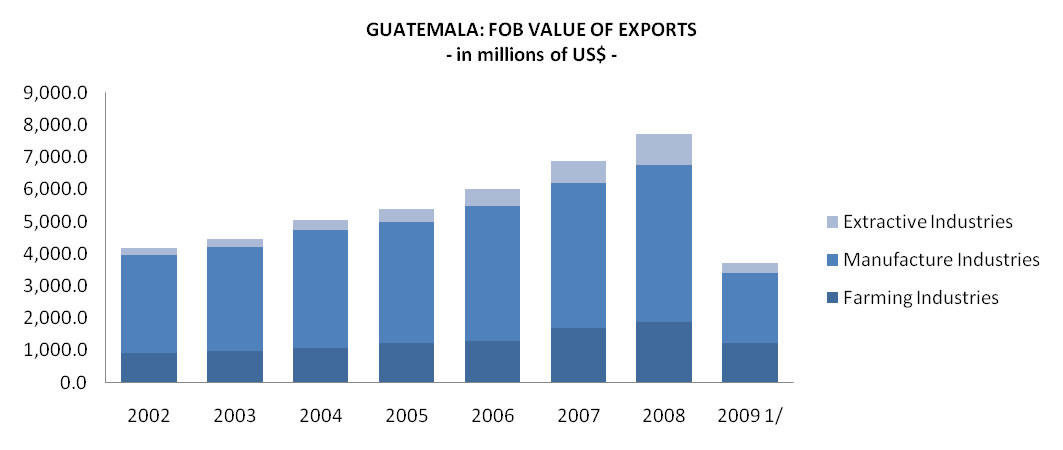
After the Second World War, Guatemalan government saw the need to reduce overreliance on agriculture by emphasizing on light industries. In fact, the country has been exporting products from light industries since 1970s, including tires, pharmaceuticals as well as clothing.
Despite this, agricultural products still remain the major form of economic activity, taking over 58% of the national labor force and accounting for over two—thirds of the country’s foreign earnings. Moreover, the country’s standards of living are relatively low, while personal income is yet to achieve the international standards. There is no domestic market in existence, with an exception of the subsistence crops.
Although the economy was booming between 1971 and 1974, it was adversely affected by an inflation that reached 21.2% by the end of 1974 and the worldwide crisis in energy. The annual population growth hit 2.9%, while the growth of the nation’s economy reached hit 7.6% in 1976 and 4.6% by the end of 1974 (Chase-Dunn 124).
The peace accords signed and implemented in 1996 marked the beginning of a new era, enhancing economic, social and political development after 36 years of civil war and unrest (Benería 43). The accords required the government, the former rebels and opposition factions to collaborate in social and economic development.
It further required them to collaborate in cessation of hostilities, human rights improvement, disarmament and other areas such as tax policy, labor, social spending, rural infrastructure and other areas of importance to the country’s economy.
Purpose statement
The purpose of this paper is to review the economic development and performance for Guatemala. The aim is to determine the level of economic development and performance, factors affecting this development and performance and the prospects for the country’s economic future.
Demographics
According to the CIA World Fact Book (2012), Guatemala has a total population of around 14.01 million. The country’s age structure is well distributed, representing a common structure and distribution of a low-income country.
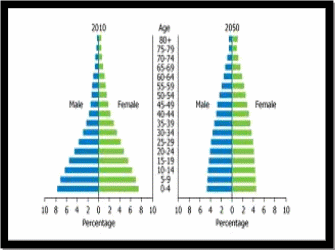
Statistics indicate that 37% of the total population is made up of people below the age of 14 years, while youths aged between 15 and 24 years make up some 22.2% of the total population (Krznaric 114). In addition, people aged between 25 and 54 years represent a section of about 31.3% of the total population. People aged between 55 and 64 years make up some 5.1%, while the elderly people (above the age of 64 years) represent the lowest ratio of 4%.
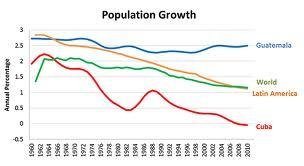
Guatemala’s population growth rate stands at 1.95%. The country has a birth rate of 26.48 births per 1000 people, a death rate of 4.92 deaths per 1000 people and a net migration rate of about -2.08 migrants per 1000 people.
The total infant mortality rate stood at 25.16 deaths per 1000 live births, with a male infant mortality rate of 27.34 deaths per 1000 live births and a female infant mortality rate of about 22.87 deaths per 1,000 live births (Krznaric 124).
While total life expectancy rate of females stands at 73.14 years, that of the males stands at about 69.29 years, making a total of 71.17 years for the total population. Finally, the total fertility rate, going by 2012 estimates, stands at 3.18 children born per woman.
Economic growth and performance
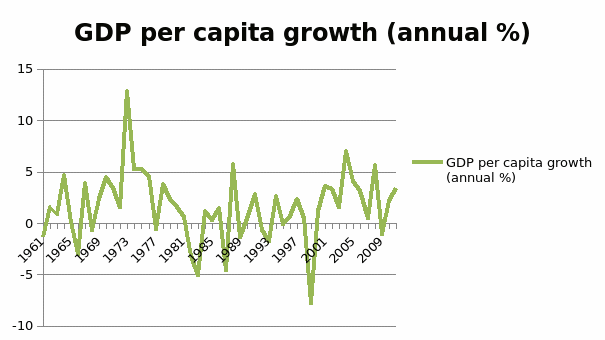
Guatemala has an estimated per capita income of around $4,155, which means that the country has crossed the poverty line, despite being slightly below the $4,663 average for the lower-middle-income nations in Latin and the Caribbean. Although Guatemalan GDP per capita has grown by an average of at least 2.2% per annum since 2007, the rate is still far below the average recorded in the region (Krznaric 118).
For instance, the comparator countries such as Costa Rica and Chile have some of the largest GDPs per capita in the region, with at least $10,437 $11,937 respectively (Krznaric 114). According to the peace accord signed in 1996, the socioeconomic aspects and the agrarian situation has been given a priority in the country’s development.
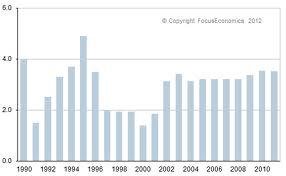
This section, established in paragraph 18 of the accord, has established that the national government would adopt some economic policies in order to permit the nation to embrace sustainable growth rate of at least 6% per annum. However, the country was still performing poorly, with its economic performance between 1996 and 2004 being generally disappointing and below the accord’s target. For instance, the average economic growth at the period averaged at 3.3% per annum.
In addition, the actual GDP growth was generally slow between 2001 and 2004, only reaching 2.2% per annum (Benería 71). However, the growth started progressing, reaching around 3.2% per annum by 2005. By contrast, other members of the LMI-LAC averaged at 3.7% per annum, with Chile and Costa Rica having the largest economic development at 6.1% and 3.2% respectively (Krznaric 139).
Despite the fact that the 3.2% per annum performance for 2005 is a remarkable improvement in economic development, it is worth noting that this rate cannot effectively sustain the needed levels of employment, poverty reduction and dynamism needed to reduce the country’s cancerous levels of poverty. Moreover, this level is still less than the levels of economic development outlined in the 1996 peace accords. As such, the country is yet to achieve its targets in social and public investments as the required in the peace accords.
Human capital formation
According to Krznaric (134), the primary cause of these discrepancies can be traced back to inadequate investment as well as issues related to low productivity. For instance, the country’s gross fixed investment for the fiscal year 2004 stood at 17.6% of the total GDP, nearly one point below the 18.5% achieved by the LMI-LAC. In addition, this level was still some points behind the benchmark of 24.3% in statistics.
In terms of labor, the country performed quite poorly, with a negative average of -1.1 % per annum between 2001 and 2005. By contrast, regional member states such as Costa Rica experienced an increased economic growth, reaching 3.7% in labor productivity since 2003. Chile has been performing quite well, reaching 1.6 per cent growth in its labor.
The incremental capital output ratio (ICOR) for the country shows a significant declining competitiveness. For instance, in 2000, the ICOR was estimated at 4.3, but by the end of 2004, but by 2007, it had reached a 7.0 mark.
This means that the country is in need of at least $7 of gross investment for every $1 in terms of extra output. With quality of capital stock and investment data taken into account, these results provide an accurate confirmation of the indications of the poor productivity and economic growth in Guatemala (Benería 53).
Government’s obligations in economic development
The Government of Guatemala announced the launching of a competitiveness program set for 2005-2015 period. This is actually an agenda that was arrived at after a long search and consultation with various parties, including the political, economic and executive branches, international economic advisors and the regional players.
Six subprograms have been recognized under the agenda. For instance, cluster development for national exports, strengthening of the institutions, rural and economic development and environmental and business social responsibility. Despite the fact that the agenda has now lasted over a half of its expected period, there is little evidence that the program will have achieved its target by the end of its period in 2015.
Economists have shown that two factors will determine whether the agenda will be effective in improving the economic performance of the country (Benería 53). First, the ability and willingness of the national government in putting real monetary resources in the program and secondly, whether individual subprojects within this agenda will be developed, implemented and in accordance with the principles set in 2005.
There is need for the country to work closely with donors in financing the projects under the program. When designing such activities, donors should work with other parties to the program both during and after the development and implementation of the subprojects (Benería 53).
Poverty levels and inequality in Guatemala
Although both the World Bank and the International Monetary Fund consider Guatemala, poverty and inequality levels are significantly lower than that recorded in other low-income nations in Africa and Asia. In fact, it has been established that Guatemala does not face significant challenges in terms of inequality as well as poverty levels (The World Bank 12).
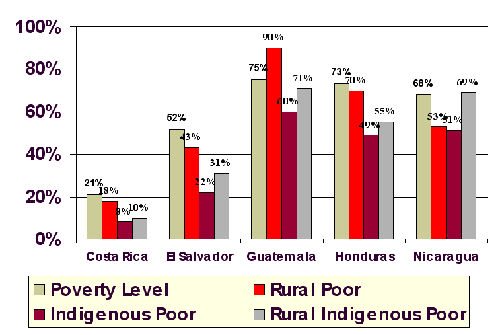
Data shows that 56.12% of the people in the country are living well below the national level of poverty. In fact, this level is 15.2 points above the 40.6% benchmark of regression. This provides an estimate of the national levels of poverty in relation to the 37.5% levels set by the LMI-LAC.
According to the United States Aid (USAID), the difference in poverty rates between the indigenous and the non-indigenous citizens provides a key factor through which one can understand the equation of poverty in Guatemala (Arends 87). From this analysis, it is worth noting that about 40% of the people in Guatemala are indigenous.
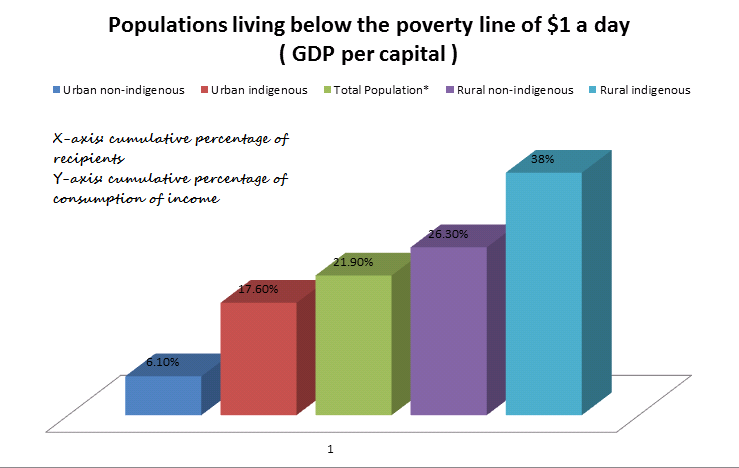
The 2000 census, which was a headcount conducted by the authorities, the level of poverty among the indigenous people was about 74%, while that of the non-indigenous people was about 38% (The World Bank 12). Moreover, government statistics in the same year indicated that approximately 24.3% of the indigenous Guatemalans, while that of the non-indigenous was approximately 6.5% (The World Bank 12).
Capital accumulation
Data provided by the international community is a composite index used to measure three-dimension of human development based on a scale of 0 (deprivation) to 100 (extreme deprivation). In 2000, the same year the government conducted a headcount census, HPI measure indicated Guatemala had a score of 22.9%.
By global standards, this is “not bad”, although it was worse when compared with the regression mark of 17.1% and with Costa Rica (4.0%) or Chile (3.7%). This means that in the international arena, Guatemala is the 43rd out of all the 94 developing nations. In contrast, Chile was ranked the third while Costa Rica was ranked the fourth in the same system (Benería 76).
According to the World Bank, one in four people in South America survive with less than 2 US dollars in a day. In the case of Guatemala, the same report indicates that 37.3% of the total population live in this poverty line, while 13.5% of the population survive on less than1 US dollar a day. In comparison, only about 0.8% and 2.0% of the people in Costa Rica and Chile respectively live under less than 1 dollar in a day (The World Bank 12).
In addition, both countries have only less than 4% of their population living below the minimum level of energy consumption recognized in the international standards. In fact, the poor distribution of income and resources is based on racial differences, with the majority group of people (the indigenous descendants of the Maya), and living below the international standards of income and resource distribution.
On the other hand, the minority group, mainly the people of the Spanish and Portuguese decencies, has the largest advantage in social and economic terms. Most of these people live better lives and control more than 90% of the economy, education, health, security and other political and social sectors.
For instance, Guatemala was second after Brazil as the worst income distribution of any nation in the region (Benería 83). Guatemala scored a coefficient of 58.3 on Gini scale. In 2002, the country had 59.5% of the total income accrued to the richest 20% of the country’s total population.
It had only 2.8% of the national income accrued to the lower 20% (Benería 88). In addition, Costa Rica has been known to the Latin America’s most affected nation by poor distribution of resources since colonial times. In 2002, Costa Rica had 54% of the income accrued to the top 20%, while 3.9% of the country’s income was accrued to the bottom 20%.
Geographic information
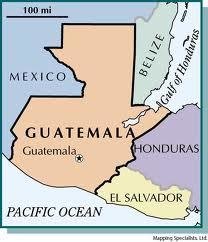
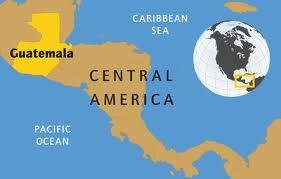
Guatemala is located at 15 30 N, 90 15 W in Central America. It borders the Gulf of Honduras, Mexico, Belize, Honduras, El Salvador and North Pacific Ocean. It has an area of 108,889 sq km and is tropical with hot, humid in lowlands and cooler in the highlands. It is highly mountainous with narrow plains.
International linkage
The major linkage between Guatemala and her neighbors is by road transport, with 14, 000 km of road. In addition, it is connected to Mexico and Honduras by rail. However, the country’s major ports at Puerto Quetzal and Santos Tomas de Castilla are important linkage points to other parts of the worlds.
Conclusion
This analysis indicates that despite the progress made by Guatemala since the signing of the peace accords in 1996, the country remains underdeveloped, with a poor human capital distribution, high rates of inequality, high rates of poverty and high rates of employment.
One of the possible reasons for these poor aspects of social and economic developed is the history, considering the fact that the country experienced some 36 years of civil war and more than 300 years of racial discrimination, especially against the majority indigenous red Indians. The analysis shows that the country has the opportunities to enhance its economic and social growth, given that it has a relatively small population, a medium population growth rate and a massive source of agricultural, mineral and other natural resources.
Works Cited
Arends, Mary. Female Labor Force Participation and Earnings in Guatemala. Case studies on women’s employment and pay in Latin America. Washington, D.C, 2002. Print.
Benería, Lourdes. Gender, Development, and Globalization. New York: Routledge, 2010. Print.
Chase-Dunn, Christopher. “Guatemala in the Global System.” Journal of Interamerican Studies and World Affairs 42.4 (2000): 109-124. Print
Krznaric, Roman. “The Limits on Pro-Poor Agricultural Trade in Guatemala: Land, Labour and Political Power.” Journal of Human Development 7.1 (2012): 112-134. Print.
The World Bank. Data; Guatemala. Washington, DC: The World Bank, 2012. Print
CIA World Fact Book. Central American and Caribbean: Guatemala. CIA, 2012. Web.
Appendices
Appendix A: Geography
Appendix B: Economy


Appendix C: Demographics
Appendix D: Inequality
Appendix E: Unemployment
Appendix F: International linkage: Exports and Imports
