Weight Changes Overview

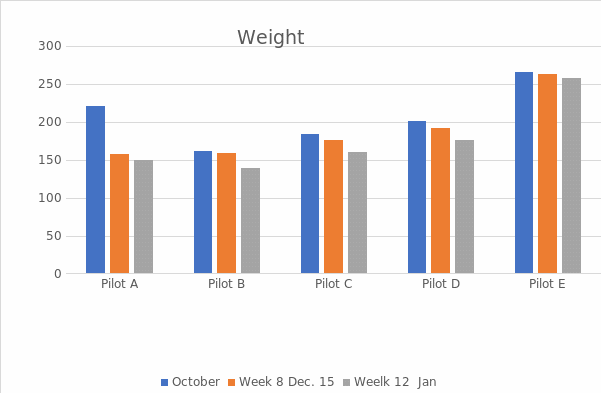
The bar chart deals with the changes in the weight of five pilots suffering from obesity during three months (October, December, and January). All the pilots began the program having different weight indicators and, therefore, have reached various numbers by January.
According to the graph, the weight tended to go down for each participant. The most significant drop appeared to happen to pilot A in December (pilot A lost 63 pounds, which equals 28,5% of the starting weight). The least considerable reduction occurred in pilot E (8 pounds lost in total, which equals 3% of the starting weight). Other pilots’ weight changes were less noticeable (between 12,8% and 14,1% of the starting weight).
Overall, the weight of all pilots was steadily declining reaching considerably lower numbers in January in comparison to October, which proves the effectiveness of the program. Pilot A’s weight decline was the most drastic, while pilot E’s weight drop remained almost the same with an insignificant plummet.
BMI Changes Overview

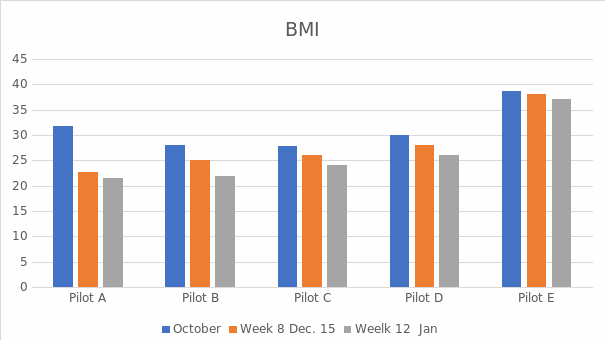
The bar chart deals with the changes in BMI of five pilots suffering from different degrees of obesity during three months (October, December, and January). All the pilots began the program having different BMI’s and, therefore, have reached various numbers by January.
According to the graph, the BMI tended to go down for each participant. The most significant drop appeared to happen to pilot A in December (the Body Mass Index fell from 31,71 to 22,66, which equals 28,5% of the starting index). The least significant drop happened to pilot E (the index dropped from 38,62 to 37 in total, which equals 3% of the starting index). Other pilots’ changes in BMI were less noticeable (between 12,8% and 14,1% of the starting index).
Overall, the BMI of all pilots was steadily declining reaching considerably lower numbers in January in comparison to October, which proves the effectiveness of the program. Pilot A’s BMI decline was the most drastic, while pilot E’s BMI drop remained almost the same with an insignificant plummet.
Changes in Neck Circumference Measurements

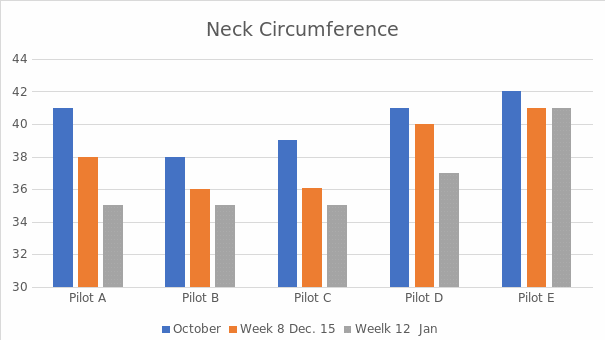
The bar chart deals with the changes in neck circumference measurements of five pilots suffering from different degrees of obesity during three months (October, December, and January). All the pilots began the program having different neck circumference measurements and, therefore, have reached various numbers by January.
According to the graph, the neck circumference tended to decrease for each participant. The most significant change appeared to happen to pilot A in January (the measurement of neck circumference declined from 41 to 35 inches, which equals 14,6% of the starting measurement). The least significant drop happened to pilot E (the measure of neck circumference decreased from 42 to 41 inches in total, which equals 2,3% of the starting measurement). Other pilots’ changes in neck circumference measurements were less noticeable (between 7,9% and 10,25% of the starting measurements).
Overall, the neck circumference measurements of all pilots were steadily declining reaching considerably lower numbers in January in comparison to October, which proves the effectiveness of the program. Pilot A’s decline in the measure was the most drastic, while pilot E’s measurement drop remained almost the same with an insignificant plummet.
Changes in Waist Circumference Measurements

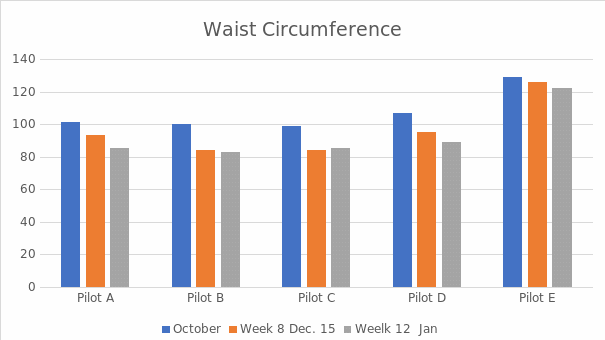
The bar chart deals with the changes in waist circumference measurements of five pilots suffering from different degrees of obesity during three months (October, December, and January). All the pilots began the program having different waist circumference measurements and, therefore, have reached various numbers by January.
According to the graph, the waist circumference tended to decrease for each participant. The most significant change occurred in pilot B in January (the measurement of waist circumference declined from 100 to 83 inches, which equals 17% of the starting measurement). An equally sharp change happened to pilot D (the measure of waist circumference declined from 107 to 89 inches, which equals 16,8% of the starting measurement). The least significant drop happened to pilot E (the measure of waist circumference decreased from 129 to 122 inches in total, which equals 5,4% of the starting measurement). Pilot C demonstrated unsteadily changing measurements (it dropped dramatically in December, but then slightly increased in January making an overall drop of 14 inches, which equals 14,1% of the starting measurement). Pilot A’s measurement also demonstrated a noticeable decrease (from 101 to 85 inches, which equals 15,8% of the starting measurement).
Overall, the waist circumference measurements of most pilots were steadily declining reaching considerably lower numbers in January in comparison to October, which proves the effectiveness of the program. Pilot C’s decline in the measure was unsteady with a significant decrease and the following increase, while pilots’ B and D measurements were the most drastic. Pilot E’s measurement drop demonstrated an insignificant plummet.