Introduction
Vision and hearing are the two major systems allowing humans to perceive the world and therefore, understanding the underlying mechanisms that guide these processes is crucial. The performed experiment aimed to observe and measure the hearing and vision systems by assessing different factors and using simple tests. From the physiologic perspective, hearing is the ability to detect sounds, which are sound waves that differ in frequency and amplitude that define pitch and loudness. Vision is one element of perception that allows one to see objects due to light being focused on the retina. Other relevant research on the topic includes Bach and Schafer (2016), Abu-Ghanem et al. (2016), and Bastawrous et al. (2015), which offer new insight and improved procedures for the chosen testing methods. Thus, it can be hypothesized that a person’s hearing can be tested by varying frequencies and amplitude, while visual capabilities can be examined using Snellen’s chart and FrACT.
Method
This lab consists of two separate experiments, one testing the hearing system and the second for assessing the visual abilities of an individual. The hearing was evaluated using headphones and a bone conduction device for the bone marrow study. The participant was sited in the lab, and the researcher chose one ear, either left or right, for each test. The following frequencies were used – 1 kHz, 2 kHz, and 4 kHz. Thus, the protocol for this procedure involves increasing the frequency by 1 step each time while the participant reports hearing a sound.
The experiment was performed using a Snellen chart and FrACT to test the acuity of the participant’s vision. For the first test, the participant was placed 6 meters before the table and reported the elements on it, including the line number. An essential aspect of the protocol is the fact that one eye should be covered for the accuracy of the examination. For FrACT, ac computer displayed C letters to an individual, in different locations and angles and the person had to indicate the direction of each C. No deviations from the strategy outlined in the manual were present. For data analysis, all the results reported by the participants were recorded in a chart.
Results
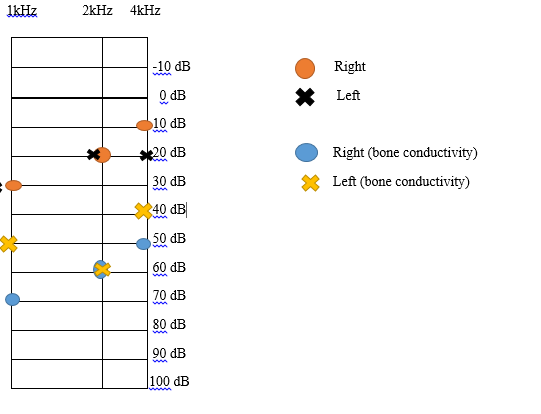
It was observed that the participant had different hearing capabilities when comparing the left and right ears and bone conductivity. The overall range was from 10dB to 70dB and 1 kHz to 4 kHz. Figure 1 summarizes the results of the hearing test, while figure 2 displays the outcomes of the visual examinations. We found that the left ear was unable to detect sound at 1 kHz. Also, no noise was reported by the individual in the range from -10 dB till 10 dB and in the range of 30 dB to 100 dB. The visual tests, both computerized and manual helped record the fractions of the eye, which for participant one were estimated at 6/6 for both eyes.

Figure 2. Visual test results (created by the author).
Discussion
The results indicate that the examined individual has excellent hearing capabilities and acute vision. Bach and Schafer (2016) argue that the Snellen chart and FrACT are the current standards of clinical testing. The research on a similar topic demonstrates that these approaches to examination are valid. For instance, Bastawrous et al. (2015) compared the Snellen chart and mobile phone application to determine the ability of the two to define the acuity of vision accurately. The results indicate that the Snellen table remains to be the best clinical method for determining accurate vision capabilities. However, other strategies can be used for primary diagnosis. Since the participant of this lab had an excellent vision in accordance with the 6/6 and FrACT. In general, the result soft of the conducted tests corresponds with the evidence presented by Bach and Schafer (2016), Abu-Ghanem et al. (2016), and Bastawrous et al. (2015). The procedures allow identifying test subjects’ sensitivity to sound waves and light.
The physiological reasoning for the obtained results is the ability of the human sensory systems to perceive light and sound waves. In regards to hearing, the sensitivity of the person which is reflected in the ability to hear sounds is tested by changing frequencies and amplitude. The vision test examines acuity by applying principles of light reflection and retina functioning. The limitation of these tests is in the design of the examination procedures.
The Snellen chart requires individuals with poor vision to read a smaller number of characters, which may obstruct them from accurately identifying the range. Bach and Schafer (2016) state that with this test, an individual can receive feedback from a professional conducting the experiment, which will also impact the outcomes. The fact requires access to a computer and software and sufficient information technology skills from the participants, which can be a difficulty with older populations. The hearing test’s limitations are described by Abu-Ghanem et al. (2016) as a trial and error approach that can lead to inaccuracy of result interpretation. Therefore, one can argue that while the performed tests are considered to be best practices, they can be further improved to ensure the mitigation of bias. Overall, these experiments provide an assessment of the generally accepted approaches to testing visual and hearing acuity.
References
Abu-Ghanem, S., Handzel, O., Ness, L., Ben-Artzi-Blima, M., Fait-Ghelbendorf, K., & Himmelfarb, M. (2016). Smartphone-based audiometric test for screening hearing loss in the elderly. European Archives of Oto-Rhino-Laryngology, 273(333). Web.
Bach, M., & Schafer, K. (2016). Visual acuity testing: Feedback affects neither outcome nor reproducibility, but leaves participants happier. PLOS ONE, 11(1), e0147803. Web.
Bastawrous, A., Rono, H., Livingstone, I., Weiss, H., Jordan, S., Kuper, H., & Burton, M. (2015). Development and validation of a smartphone-based visual acuity test (peek acuity) for clinical practice and community-based fieldwork. JAMA Ophthalmology, 133(8), 930. Web.