Company background
Hewlett-Packard is a private limited company that operates in the US diversified computer systems industry. The firm was established in 1939 and managed to attain a global presence. Its headquarters are located at Palo Alto, California.
The firm specializes in designing and manufacturing various computer products such as software, hardware devices, data storage devices, and networking. To maximize its sales revenue, HP markets its products to both individual and institutional customers.
HP has incorporated direct and indirect product distribution methods. The firm has partnered with major technology vendors, office-supply retailers, consumer-electronics suppliers and software partners in different parts of the world.
Additionally, the firm has also integrated online distribution which has enabled it to be effective in distributing its digital products.
Vision and mission statements
In the course of its operation, HP views change as a source of the business opportunity that can stimulate its growth.
As a result, the firm is focused on utilizing its financial and human capital capabilities in designing and developing innovative technology solutions that will continually satisfy its customers.
Moreover, HP is committed to delivering value to its customers by offering high-quality products and services. As a result, the firm has managed to develop a high level of customer loyalty (“HP: Investor relations” par.1).
Description of any unusual event disclosed to shareholders
Currently, HP’s common outstanding stocks amount to 2 billion shares. On 21st March 2013, HP’s management team announced to the firm’s shareholders’ regarding the Board of Directors intends to increase the quarterly dividend paid to investors with a margin of 10%.
This will increase the quarterly dividend issued to shareholders to $0.1452 per share. The increase is expected to be effected in May 2013 (“HP: Investor relations” par. 2).
HP faces intense competition from Dell Incorporation. This paper entails a comparative report of HP’s and Dell’s Incorporation. The report focuses on the two firm’s financial performances.
Financial analysis
Common size analysis
This analysis is used to analyze the performance of a firm over a certain period for example 5 years (Courtney& Briggs 63). The common size income statement illustrated below shows that HP has experienced both positive and negative financial performance over the past few five years.
For example, the firm’s gross profit declined from $ 29,726 million dollars in 2009 to $27,972 million in 2012. The decline may have resulted from an increment in the intensity of competition, especially from smartphones and tablets.
On the other hand, the firm’s operating expense increased from $ 18,437 million in 2010 to $ 39,029 million in 2012. The firm has also experienced a similar performance about its net income as illustrated by the chart below.
Chart 1
Source: Morningstar: Hewlett Packard Company
Common size balance sheet
The balance sheet below illustrates HP’s financial performance over the past five years about assets, liabilities and the shareholder’s equity. The chart shows that HP has experienced significant improvement in its financial position over the past five years.
This is evidenced by the increment in the firm’s total assets compared to the total liabilities. Similarly, the firm’s total liabilities and the shareholders’ equity have increased significantly.
From the balance sheet, it is evident that HP has experienced significant improvement in its capacity to cover its short-term debts when they fall due.
Chart 2
Source: Morningstar: Hewlett Packard Company
Trend analysis
According to Milano and Robnett (145), trend analysis entails evaluating changes in a firm’s financial balances over a particular period for example 5 years. The greatest advantage associated with trend analysis relates to its simplicity.
Milano and Robnett (145) further assert that trend analysis is undertaken by evaluating certain components of the income statement or the balance sheet over a certain period.
HP has managed to increase its total assets over the past five years. However, in 2012, total assets declined to $108,768 million as illustrated by figure 1. Similarly, total liabilities and equity have undergone the same trend as illustrated by figure 2.
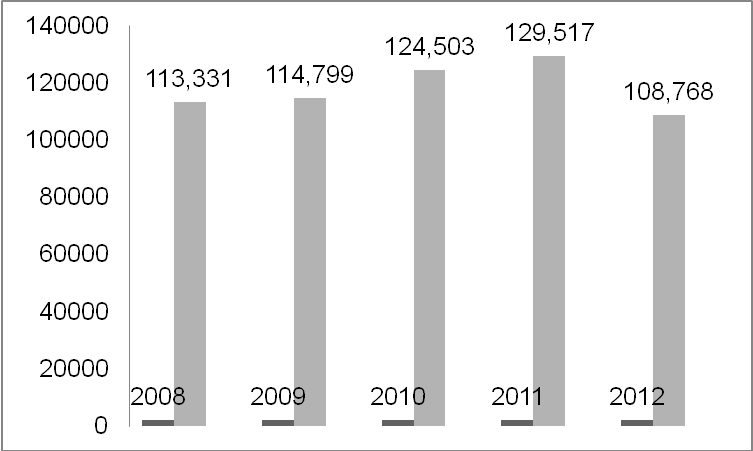
Figure 1
Source: Morningstar: Hewlett Packard Company
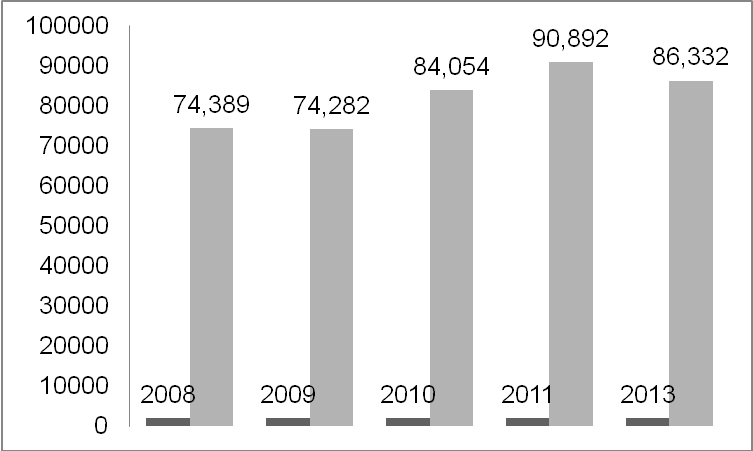
Figure 2
Source: Morningstar: Hewlett Packard Company
From 2009 to 2011. Hp’s sales revenue increased from $ 114,552 million to $127,245 million. However, in 2012, the firm’s sales revenue declined to $ 120,357 as illustrated by the graph below.
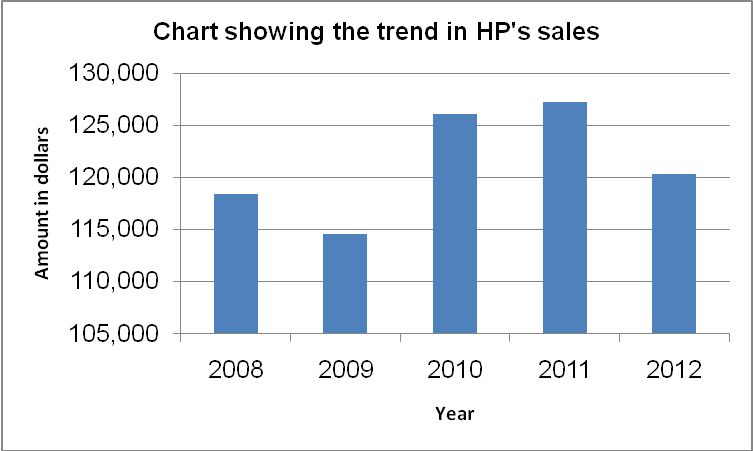
Figure 3
Source: Morningstar: Hewlett Packard Company
Gross profit margin and net income
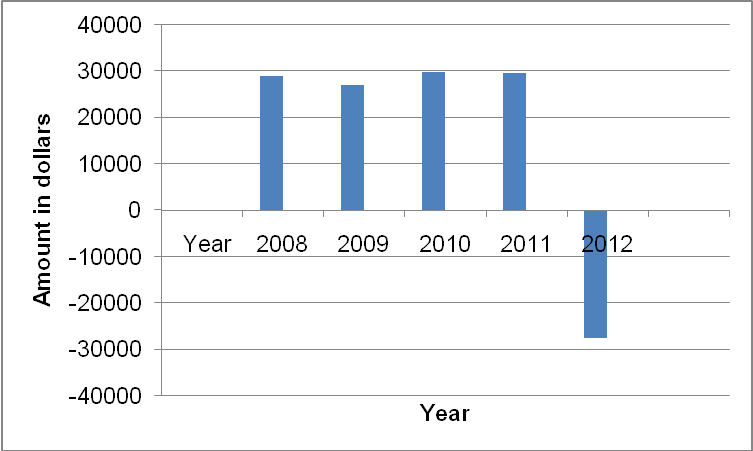
Figure 4
Source: Morningstar: Hewlett Packard Company
Despite the 2008 global economic recession, HP managed to maintain a positive trend about gross profit margin and net income. However, the firm incurred a substantial decline in its gross profit margin and net income in 2012 as illustrated by figure 2 and 3 respectively.
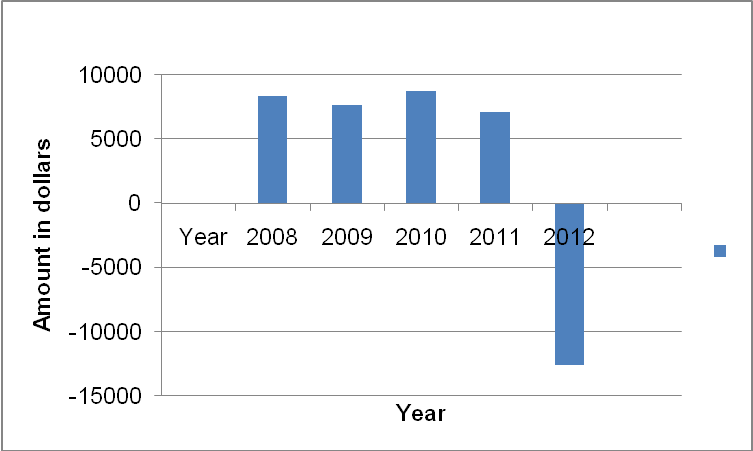
Figure 5
Source: Morningstar: Hewlett Packard Company
Financial ratios: Liquidity ratios
Current ratio
The ratio is used in determining the effectiveness with which an organization can meet its short-term financial responsibilities. The ratio is calculated using the formula; [current assets ÷ current liabilities] (Mark 266).
According to financial analysts, the current ratio of 2:1 shows that a firm is in a good financial position to cover its short-term obligations when they fall due. On the other hand, the current ratio higher than 2:1, for example, 3:1 shows that s firm is holding extra cash in its current assets.
HP’s current ratio (1.1:1) is relatively lower compared to that of Dell (1.2:1). The ratio indicates that HP can cover its current liabilities 1.1 times while Dell can cover its current liabilities 1.2 times (“Morningstar: Dell Incorporation” 1).
Quick ratio
The ratio is calculated using the formula; [Current assets-inventory] ÷current liabilities.
Acid test ratio is used to determine the degree to which organizations can cater to its current debts when they fall due without selling their inventories. Norton and Diamond (733) assert that the ideal acid test ratio should be 1:1.
A high quick ratio indicates that an organization may have a problem catering for its current liabilities. An organization with a high quick ratio is required to hold a relatively large amount of money in cash to cater to its current liabilities (Gitman & McDaniel 34).
From the analysis, it is evident that HP is effective in managing its quick ratio compared to Dell. The firm’s quick ratio is 0.9:1 which is considered to be the ideal ratio.
Solvency ratios
These ratios are calculated to determine the effectiveness of an organization to meet its long-term debts and their associated interests. By calculating the solvency ratios, firms’ management teams can determine the likelihood of their organizations surviving in the long term.
Current debts to inventory
The ratio is used to illustrate the degree to which an organization relies on inventory in repaying its debts. The ratio is calculated using the formula; current liabilities ÷ inventories.
HP has a relatively high current debt to inventory ratio (7.4:1) compared to that of Dell (3.7:1. This suggests that HP relies more on inventory in financing its operations compared to Dell.
Current debts to net worth
This ratio is calculated using the formula; [current liabilities÷ net worth]. The ratio is used in determining the amount of money that is due to creditors.
The current debt to net worth ratio is illustrated below.
Total liabilities to net worth
the ratio is calculated by dividing the total liabilities with the net worth. According to Khan and Jain (76), the ratio indicates the relationship between the owners’ equity and the total debts in an organization.
HP has relatively higher total liabilities to net worth ratio compared to Dell Incorporation. This shows that the firm is more effective in repaying its creditors compared to Dell.
Profitability ratios
Gross profit margin
The margin is calculated by dividing gross profit with the sales revenue for a particular financial year.
The margin is used to illustrate an organizations’ ability to cover its operating expense and at the same time earn a profit (Khan & Jain 78). Below is a comparison between HP and Dell’s gross profit margin.
Gross profit margin
HP is more effective in covering its operating expense compared to Dell Incorporation as illustrated by the difference in gross profit margins.
Net profit margin
This ratio illustrates the after-tax profit for every dollar of sales generated by an organization. Net profit margin is used to illustrate an organization’s operational management efficiency. The ratio is obtained by dividing the net income with sales.
Net profit margin
The above calculation shows that HP experienced a net loss margin of 10.5% while Dell made a net profit of 4.12% during its last financial year.
Return on assets
This ratio is obtained by dividing the net income with the total assets. It illustrates the effectiveness of an organization in utilizing its assets to generate profits.
Return on equity
The ratio evaluates the extent to which an organization utilizes the invested capital to generate profit. It is calculated by dividing the total net income with the shareholders’ equity.
Pro forma analysis for HP
HP has undergone significant growth over the past decades. However, the firm has experienced numerous challenges over the past few years. One of the factors that have increased the challenges that HP is currently facing relates to intense competition.
According to Hardy (1), the personal computer industry has become very competitive. This has arisen from an increment in the number of industry players. As a result, the market is currently characterized by numerous computer products such as smartphones and tablets.
The industry’s competitiveness is also enhanced by increased investment in cloud computing. The firm’s Chief Executive Officer Meg Whitman recently affirmed that the increase in competition is pressing the firm’s profit margin.
During its first quarter in 2013, the firm reported a decline in its sales revenue and profit margins in all its major outlets.
Consequently, the firm has projected a decline in its financial performance. In a recent interview with the New York Times, Meg Whitman asserted that the outcome of all the efforts that the firm is undertaking to cope with the intense competition would be experienced in 2014 (Hardy 6).
Some of the efforts that the firm is currently undertaking to include developing new types of business and consumer products such as low-energy servers. The firm is also investing in cloud computing and developing new types of laptops.
The firm has projected a decline in its profitability with a relatively small margin compared to 2012. Its net profit margin will decline to -10.86% from -10.5% while the gross profit margin will decline to 22.94% from 23.24%.
Despite the changes in the business environment, HP will experience a slight improvement in its financial strength. For example, the firm’s quick ratio is projected to increase to 0.97: 1 from 0.9:1. On the other hand, the firms’ current ratio is projected to increase to 1.12:1 compared to 1.1:1.
This shows that the firm’s capacity to cover its short term obligations will improve significantly.
HP will experience a slight improvement in its return on asset ratio from -11.63% to -11.05%. On the other hand, the firm’s return on equity ratio will increase from -56.4% to -41.53%.
This shows that the firm will experience an improvement in its management effectiveness (“HP: Investor relations” par. 1).
Conclusion and recommendations
The above analysis shows that HP has a relatively stronger financial performance compared to Dell Incorporation. Despite the intense competition in the personal computer industry, HP has managed to sustain a positive financial performance over the past five years.
This is well illustrated by the various financial ratios such as the liquidity ratios, profitability ratios, and the management effectiveness ratios. The pro forma analysis shows that HP will experience a relatively poor financial performance in 2013.
To improve its future financial performance, HP’s management team should consider the following:
- The firm should invest in continuous product research and development. This will ensure that its products are aligned with the market changes. As a result, the firm will gain sufficient competitiveness.
- The firm should consider investing in new product development. One of the technologies that the firm should embrace include cloud computing.
- HP’s management team should consider integrating various growth strategies such as strategic alliances.
Works Cited
Courtney, Mary and D. Briggs. Healthcare financial management, New York: Elsevier Mosby 2004. Print.
Gitman, Lawrence and C. McDaniel. The future of business: the essentials, Mason, OH: Cengage Learning, 2009. Print.
Hardy, Quentin. Declaring this is a year of fixing and rebuilding, HP posts lower profits 2013. Web.
HP: Investor relations 2013. Web.
Khan, Mark and P. Jain. Financial management; text, problem and cases, New Delhi: Tata McGraw-Hill, 2004. Print.
Mark, Baesly. GAAS guide 2009 a comprehensive restatement of standards for auditing, Chicago: Illinois, 2008. Print.
Milano, Duane and C. Robnett. The essentials of accounting, Piscataway, NJ: Research and Education Association.
Morningstar: Dell Incorporation 2013. Web.
Morningstar: Hewlett Packard Company 2013. Web.
Norton, Curtis and M. Diamond. Intermediate accounting; financial reporting and analysis, Boston: Houghton Mifflin, 2006. Print.