Introduction
An assessment of available indicators is crucial within an extensive multi-camp hospital system. The reason for this is the need to improve the efficiency of the system in order to maintain productivity, revenues, and the presence of competition. Thus, a vital objective of this paper is to analyze the existing HIM Productivity report, subsequent statements, and suggestions that can be formulated on their metrics’ basis.
HIM Data Analysis

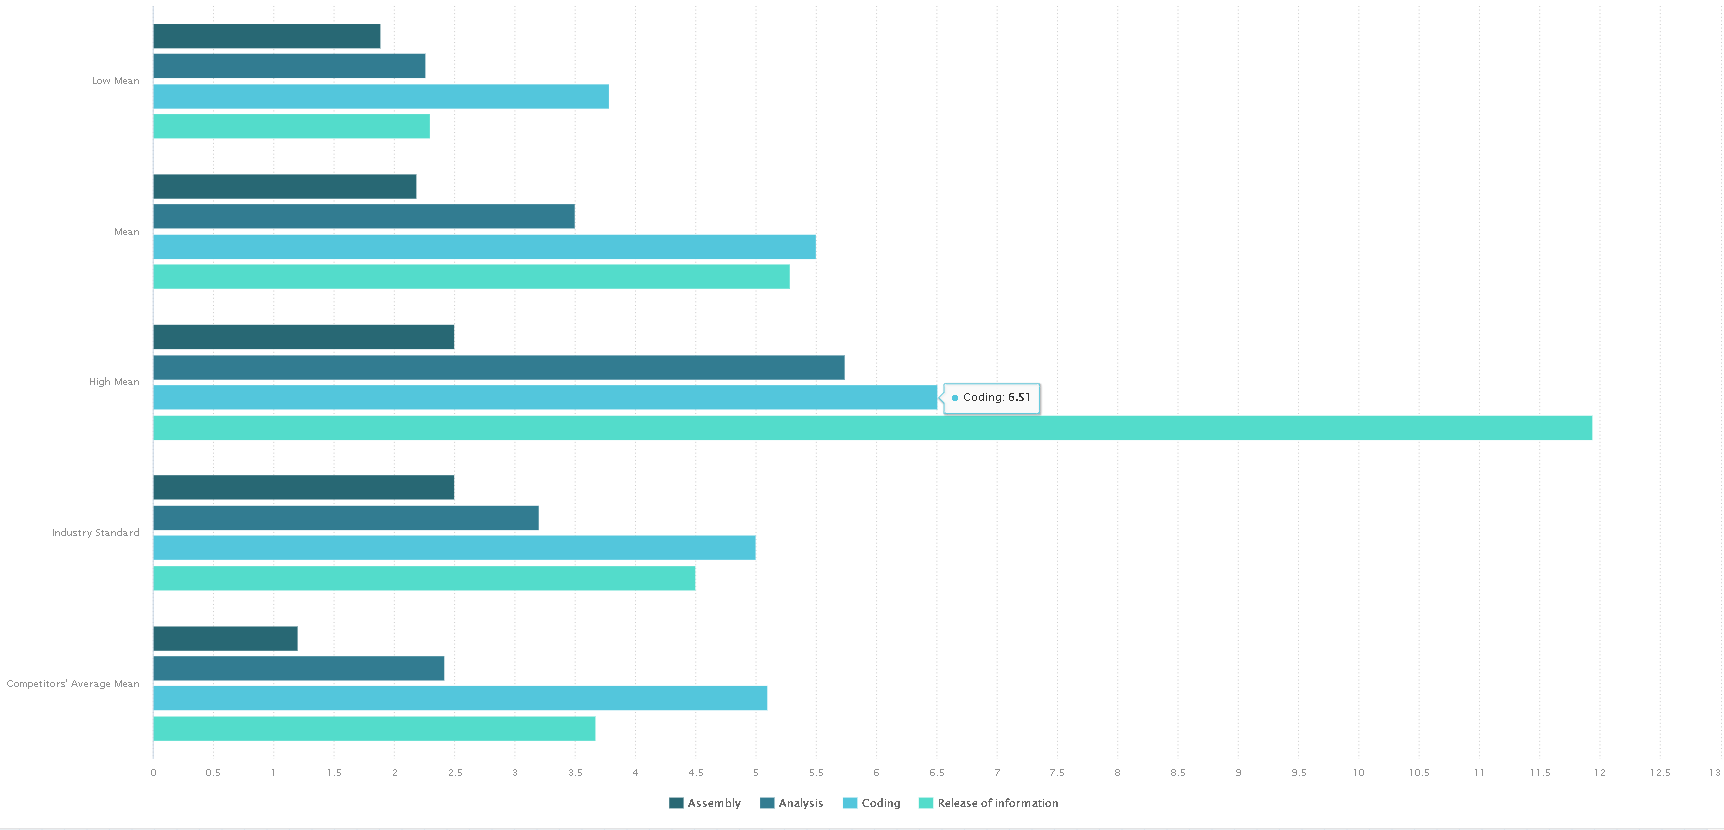
First, it is necessary to analyze the available table with different EHR system productivity indicators. For example, the release of information indicator averages of Figure 1 shows nearly five and a half days, while the standard is four and a half days, considered a severe problem. Such values are considered non-efficient according to the examples given by statistics researchers (Scan Technologies, 2021, par. 3). At the same time, facilities that use the same EHR system have a three-and-a-half-day average, hence having a decisive advantage and competitiveness.
Internal and External Benchmarking

External benchmark refers to similarities between the firm or asset and other organizations, whereas internal benchmark refers to evaluations within an organization. Consequently, applying both of these methods to the department in question is necessary as it is the most efficient method in identifying the possible issues which lead to negative results (CodeDesign Technologies Pvt, Ltd., 2021). In particular, the internal benchmarking in the release of information in the best performance in almost two and a half days, while the worst is almost twelve days (See Figure 2). However, according to the information presented by Hara & Singh, the average difference in the described range of time should be less than one and a half day (Hara & Singh, 2018). From this, one may conclude that the benchmarking demonstrates a serious issue which occurs in the HIM department’s inner processes.
Benchmarking enables hospitals and practices, independent physicians, and other healthcare institutions to track their performance compared to de-identified peers. Patient features, volumes, processes, outcomes, and other relevant categories can all be benchmarks which is an essential part of the workflow’s organizational design features. An example of the internal benchmarking would be comprising a list of employees’ KPI with a goal of creating average work results statistics. On the other hand, analyzing the response time of another company in order to draw a comparison demonstrates the core concept of the external benchmarking.
Executive Summary
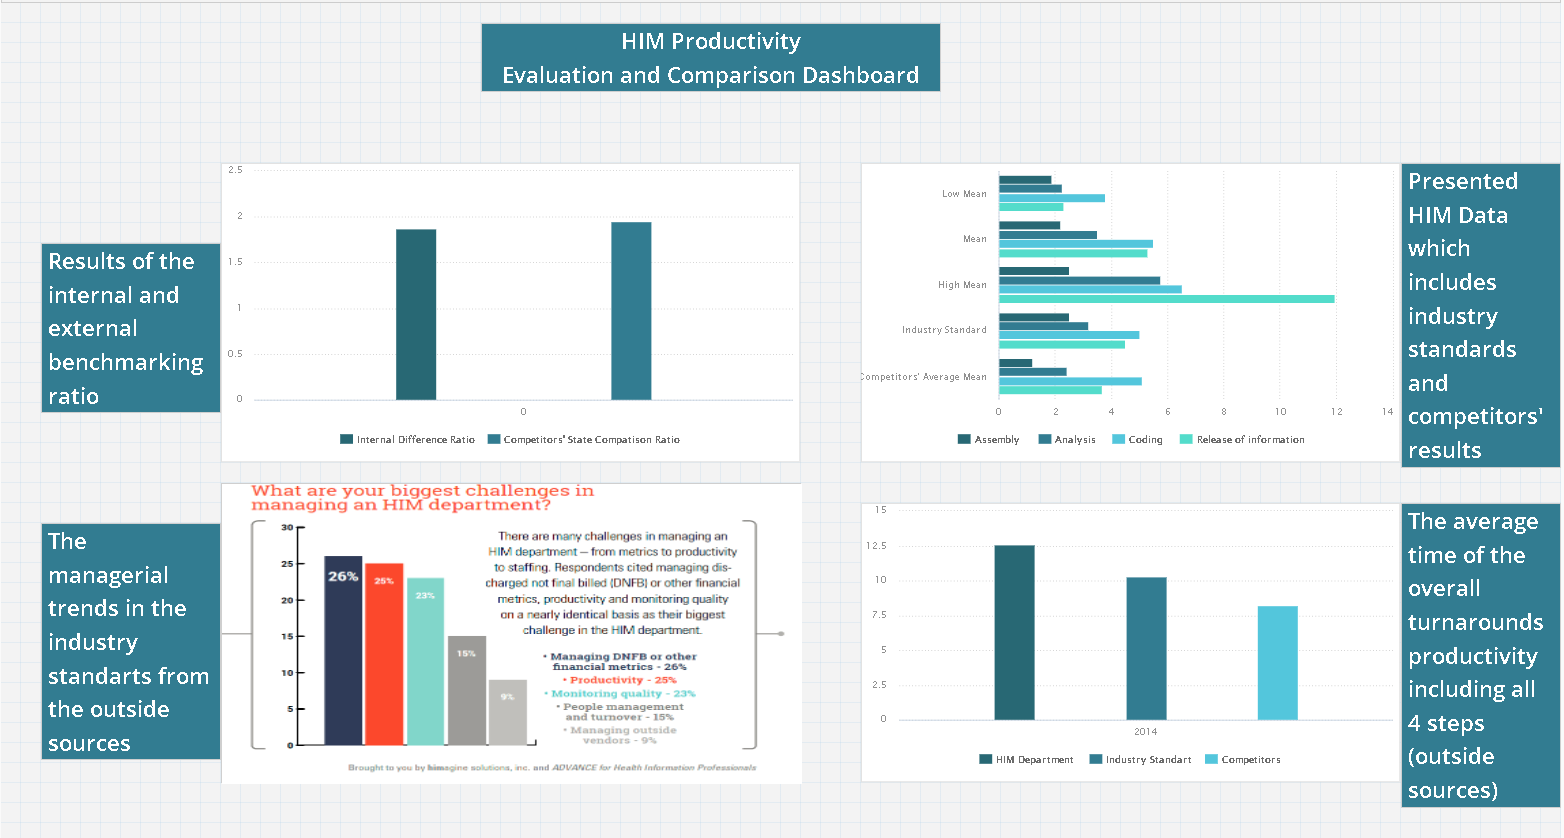
Given all the conclusions drawn, it is possible to make a summary based on the information provided. Currently, the hospital department is having severe problems maintaining adequate time slot (see Figure 3). In particular, the wide variation in timing, the failure to meet industry standards, and the notable underperformance of competitors suggest that negative trends may be occurring in the future. Furthermore, if the spread shown on Figure 1 was low and performance was noticeably worse than the industry standard variable, this would suggest a problem in the original structuring of the system and its key components (Vilmate, 2021). However, in this case the spread is high, and the “Low Mean” variable is times better than the common value. Thus, in such a situation, it is necessary to take measures in regards of the employee, their shifts and the workflow process.
Possible Solutions
The first key solution should be the reallocation of shifts. Based on Figure 1, the low mean is much better than industry standards due to the substantial temporal variation. This can be attributed to the assumption that the number of workers processing requests on the EHR system is disproportionate. Thus, if the number of employees was to remain constant over time, it would be possible to improve the average. Furthermore, the second possible innovation stems from the first and is either in the form of an increase in the number of shifts or staff. Such a move would allow requests to be processed after busy hours when patients can submit requests so that the number of pending requests does not increase during the working month.
Proposition of the New Performance Measures Plan
An additional step to improve the level of analytics will be the performance measures plan for the HIM department. The fundamental indicator, in this case, will have to be the amount of work done by each staff member. The first step would be to create a system where the efficiency of each employee would be evaluated with a ratio of the time spent and the quantity of requests which was resolved in the given time. Then, the data should be systematized in a form of a rating system which would give a wider perspective on the progress of the workflow. Finally, according to the highest and lowest results, it would be possible to generate a detailed report on which stages of turnarounds should be examined and adjusted for a higher effectiveness.
Conclusion
In conclusion, the report analyzed the available statistics in detail, explained the principles and relationships between the indicators, illustrated the available ratios, gave an executive summary, and suggested some possible solutions. If implementing the described structures and adopting innovations are successful, the positive trends will be visible in the next working quarter. Furthermore, industry standards are increasing, along with competitors’ efficiency in using the EHR system should be taken into account.
References
CodeDesign Technologies Pvt, Ltd. (2021). Internal or external benchmarking: What is the difference? – CH consulting group. Ch Consulting Group. Web.
Hara, P., & Singh, G. (2018). Turnaround time (TAT): Difference in concept for laboratory and clinician [Dashboard]. National Library of Medicine. Web.
Scan Technologies. (2021). Monitoring reporting metrics to maximize your ROI and HIM performance. ScanSTAT Technologies. Web.
Vilmate. (2021). How to build a custom electronic health records system. Nearshore Software Development Company – VILMATE. Web.