Abstract
The intrinsic job satisfaction of both males and females has no difference as the t value of their average means 0.064 and has a p-value of 0.949 which is greater than 0.05. However, there is a difference in Extrinsic Satisfaction by Position since the p-value is less than 0.05 and the t value is greater than t critical.
Introduction
Hypothesis testing is a decision-making process where a certain claim on a population is evaluated. In hypothesis testing, the population is defined as a certain claim made about the population. In hypothesis testing, a significance level is determined, a sample taken, then data relating to the sample are collected and calculations are made for testing. The result of the calculation is a conclusion. Hypothesis testing involves the creation of a null hypothesis and an alternative hypothesis. It involves parameters such as standard deviation, means, and proportions. We have several tests such as T-test, Z-test, F-test, and Chi-test (Bowerman, O’Connell, Orris, and Murphree, 2010).
In this case, the hypothesis will help to predict the expected relationship between Extrinsic Satisfaction and Position as well as intrinsic job satisfaction and gender. We will use the provided population value based on the data collected from the sample.
Hypothesis Test #1: Looking at Intrinsic Satisfaction by Gender
The question: Is there a significant difference in the Intrinsic Satisfaction for male and females?
The null and alternate hypothesis
Ho: µ1=µ2
Ha: the means are not equal
The Significance level is 95% i.e. α = 0.05
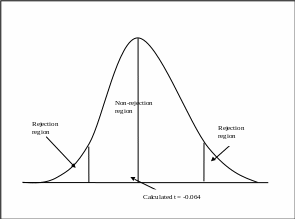
Using the test statistic: Reject H0 if t < -1.997 or if t > +1.997 one tailed
Using p-value: Reject H0 if p-value < 0.05
The test
The value of the Test Statistic is -0.064
The P-value is 0.949
P-value < 0.001

Decision
Decision (If P ≤ α, reject Ho; otherwise do not reject Ho) accepts, Ho: µ1=µ2 as P-value is greater than the selected significance level (0.05) and concludes the level satisfaction is equal for all genders. It has been found that there is no considerable difference in the intrinsic job satisfaction for both male and female.
Explanation of decision made
A significant level, α=0.05 it can be noted that -1.997<-0.064>1.997, therefore, the null hypothesis can be accepted and an alternative hypothesis can be rejected which states that there is no significant difference between the intrinsic job satisfaction of both males and females.
Applications for managers
The managers of the company can use this information to treat both male and female equally as there is a difference in their job satisfaction.
Hypothesis Test #2 Looking at Extrinsic Satisfaction by Position
H0: There is no significant difference between the means of both Salaried Employee and Hourly Employee.
Ho: µ1≠µ2
Ha: There is a significant difference between the means of both Salaried Employee and Hourly Employee.
Ha: µ1≠µ2.
The Significance level is 95% i.e. α = 0.05.
The test
t-Test: Two-Sample Assuming Unequal Variances
The critical value is 1.998, the value of test statistic is t = 2.642 and the P-value is = 0.010.
Decision
Decision (If P ≤ α, reject H0; otherwise do not reject H0). Do reject Ho: µ1=µ2, as P-value (0.010) is less than the selected significance level (0.05) and conclude Ho: µ1=µ2.
Explanation of decision made
Given that the p-value to be 0.010 and t calculated of 2.64, one will state that from the sample there is any evidence to suggest that Extrinsic Satisfaction for Salaried Employee and Hourly Employee is not the same.
Applications for managers
The manager can use this information to decide motivating factors for employees who are salaried and those on Hourly rates.
Z and T-Tests
The t distribution is similar to the z distribution in the following ways:
- It is bell-shaped;
- It is symmetric about the mean;
- The mean, median and mode are equal to zero and are located at the center of the distribution;
- The curve never touches the x-axis.
The t distribution differs from the Z distribution in the following ways:
- The variance is greater than 1;
- The t distribution is a family of curves based on the degrees of freedom, which is a number related to sample size;
- When the sample size increases, the t value nears z value. When the sample size is 30 or more, statisticians generally agree that the two distributions can be considered identical, since the difference between their values is relatively small.
Samples and Populations
A sample is a small part of the population that will be used in carrying out an analysis to estimate the characteristic of the population. A population is an entire group that the study targets to understand their characteristics (Healy, 2009).
Conclusion
Statistics and researches are vital as they are used to validate the hypothesis and conclusions. In this case, the statistical study reveals that there is strong evidence, which reflects the significant difference in the Extrinsic Satisfaction of both Salaried Employee and Hourly Employee. It reveals that there is no significant difference in intrinsic job satisfaction for both males and females.
References
Babbie, E. R. (2009). The basics of Social Research. Belmont: Cengage Learning.
Bowerman, B. L., O’Connell, R. T., Orris, J. B., & Murphree, E. S. (2010). Essential of Business Statistics. New York: McGraw Hill Irwin.
Healy, J. F. (2009). Statics: A Tool for Social Research. Belmont: Cengage Learning.