Introduction
There is an essential difference between business proposal and formal research, which is generally held in the area, which proposal represents. Originally, it is often stated that the key difference between these two aspects are in the purposes of the study, which should be performed. The original difference is in the “modicum of proof” for the premises that lead up to the Conclusions and Recommendation. The standard of proof and confirmation, which is generally required for the business research will convince an internal group of decision-makers, external supply or value-chain partners, an investor or financing source that the proposed course of action is sound.
The aim of this paper is to offer the confirmation of the research concepts and hypotheses, provided in the previous projects. The objective will be to search and identify the surveys, assessment tools or instruments which are intended to gather data on the variables that are contained within the same hypothesis which were used in the previous project assignments.
Method of Analysis
- Define the relevant null and alternative hypothesis for the test. Particular attention should be paid to this statement, as improper hypothesis will violate the accuracy of the test
- Consider the possible assumptions which are required for performing the test. The assumptions on the matters of the statistical independence should be taken into consideration.
- The relevant test statistic should be counted. In accordance with Krantz (2008) the distribution of such statistics may be derived from the original assumptions.
Hypothesis testing, which is generally arranged for the confirmation of research hypothesis and the concept, offered for the study is related with the statistical analysis of the concept, and the calculations, aimed at clarification of the concept implementation process. As Sarkar and Chang (2007, p. 562) emphasize in their research, the statistical hypothesis test is one of the basic components of the empirical research, nevertheless, the difficulties, which are faced, are generally related to unclear data. The following notion should be emphasized:
A test is a statistical procedure to obtain a statement on the truth or falsity of a proposition, on the basis of empirical evidence. This is done within the context of a model, in which the fallibility or variability of this empirical evidence is represented by probability.
In the light of this perspective, it should be emphasized that the hypothesis test, arranged on the basis of the statistical confirmation, should be performed on the fully the null-hypothesis statistical significance test.
Procedure
Statistical tests:
- 1. Collect the data.
- 2. Determine a null and alternative hypothesis.
- 3. Calculate a test statistic for that null hypothesis.
- 4. Determine if this test statistic is odd given this null hypothesis.
- 5a. If the statistic is sufficiently extreme relative to the null hypothesis, then we reject the null hypothesis.
- 5b. If the statistic is not sufficiently extreme relative to the null hypothesis, then we do not reject the null hypothesis.
Observation
- Organizational structure and the ability for employees to move up within the company.
- The means in which employees are trained and prepared for future possibilities of promotions must be inspected. It will be important to investigate the effectiveness of management to communicate with their staff and with each other, and the effectiveness of communication between departments.
- Finally, methods put in place to control pest issues and prepare for sudden temperature drops must be investigated.
As for the matters of observations, which will confirm the findings and the provide the further step of hypothesis testing, it should be emphasized that the representatives of the company should become the participants and arrangers of the testing. In order to assess the situation properly, the different areas of the organization should be investigated.
In the light of this fact, it should be emphasized that the initial research, in accordance to which the areas should be defined, is required to be arranged taking into consideration the perspective of further statistical research. As Gilboa and Shirom (2008, p, 351) emphasize:
After initial research, it appears that the areas requiring improvement are management communication with employees and with each other, developing methods to help prepare employees for growth within the company, and additional methods to retain key employees. In addition, the company needs to develop ways to prepare for sudden income decreases and ways to prevent the failures in the work effectiveness.
Test
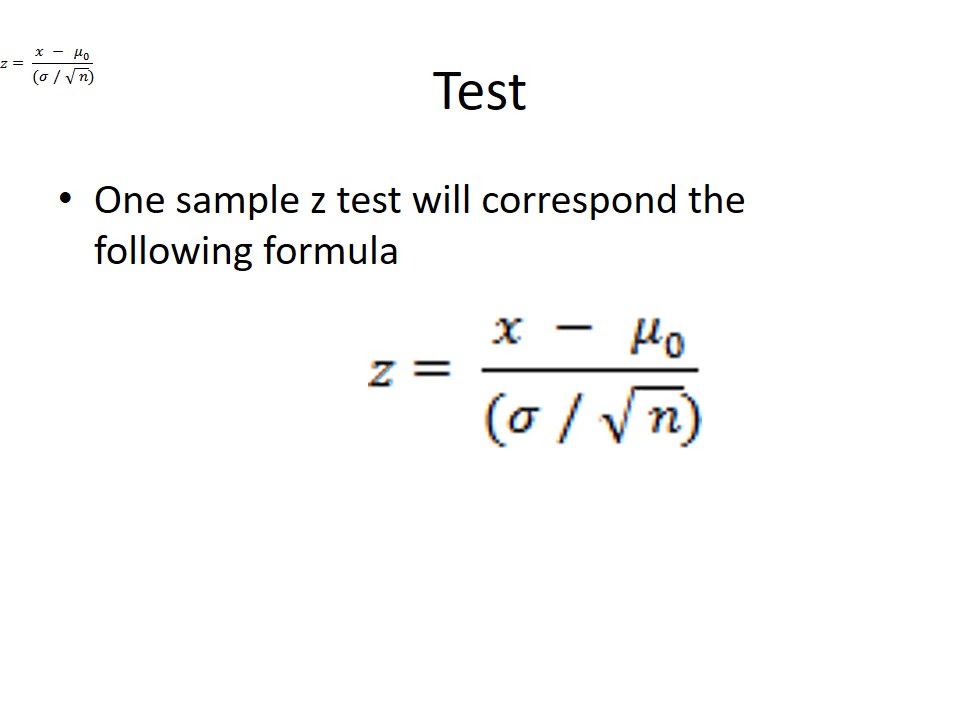
One sample z test will correspond the following formula.
The original statistical analysis, aimed to confirm the hypothesis would be based in One Sided Alternative. Thus, in accordance with the rules of this concept 25 participants will be subjected to the simulated data circumstances.
Procedure and calculations
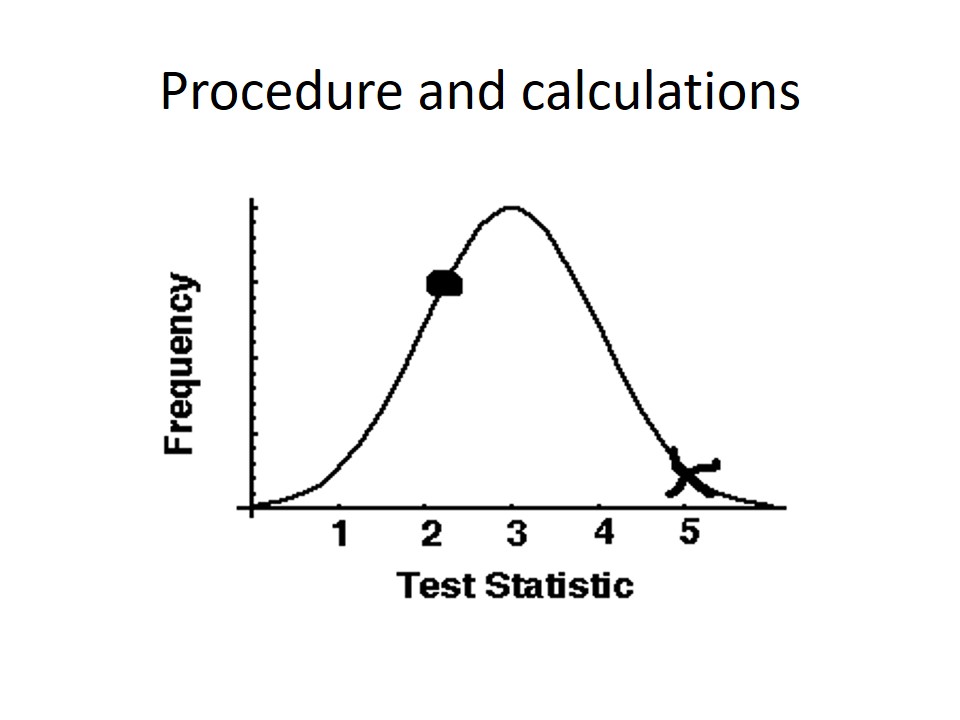
Originally, z is the distance from the mean in relation to the standard deviation of the mean. In accordance with this formula, the simulated data for 25 participants of the study will be represented on the graph.
The value of the results will not be odd, in the “O” point if the testing is compatible with the hypothesis. Nevertheless, if the null hypothesis is true, the value will be in the “X” point of the graph. From this perspective, it should be stated that similar consideration were stated in the research by Murphy and Myors (2006). They emphasized that the statistical data of the set is generally featured with two properties, which tend to vary significantly if they are interconnected. Thus, the following statement is emphasized:
If a study of annual income that also looks at age of death might find that poor people tend to have shorter lives than affluent people., thus the two variables are said to be correlated; however, they may or may not be the cause of one another. The correlation phenomena could be caused by a third, previously unconsidered phenomenon, called a lurking variable or confounding variable. For this reason, there is no way to immediately infer the existence of a causal relationship between the two variables. Murphy and Myors (2006, p. 271)
Results
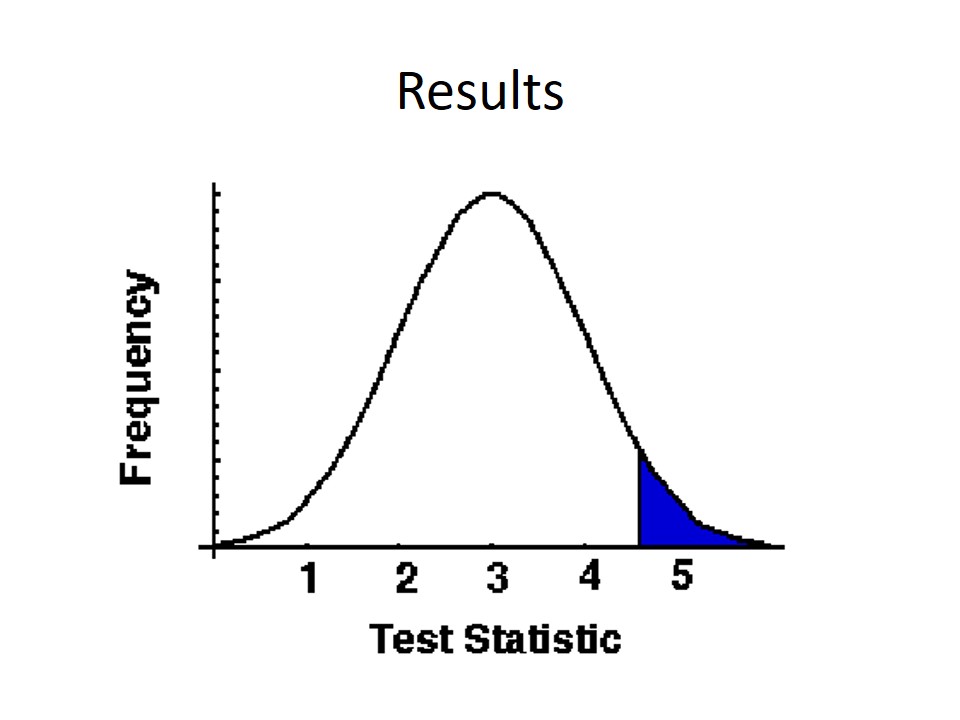
The main part of the results pointed out the correctness of the null hypothesis.
Findings
- The Statistical analysis should be arranged on the basis of null hypothesis.
- Null hypothesis of the research requires the One Sided Alternative.
- Data simulation for 25 participants is featured with essential errors in the further analysis.
- The hypothesis, offered for the project will be analyzed from the perspective of the potential contribution to the project development.
Reference List
Gilboa, S., Shirom, A., Fried, Y., & Cooper, C. (2008). A meta-analysis of work demand stressors and job performance: Examining main and moderating effects. PersonnelPsychology, 61(2), 227-271.
Krantz, D. H. (2008). The Null Hypothesis Testing Controversy. Journal of the American Statistical Association, 94(448), 1372.
Murphy, K. R., & Myors, B. (2006). Statistical Power Analysis: A Simple and General Model for Traditional and Modern Hypothesis Tests. Mahwah, NJ: Lawrence Erlbaum Associates.
Osmo, R., & Rosen, A. (2008). Social Workers’ Strategies for Treatment Hypothesis Testing. Social Work Research, 26(1), 9.
Sarkar, S. K., & Chang, C. (2007). The Simes Method for Multiple Hypothesis Testing with Positively Dependent Test Statistics. JournaloftheAmericanStatisticalAssociation, 92(440), 1601.